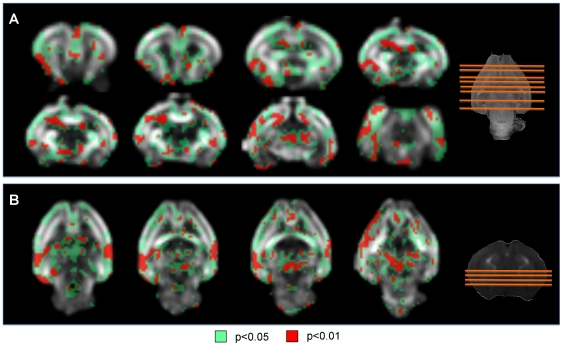
Figure 3. Fractional anisotropy values: regions showing statistically significant differences between cases and controls.
Slices of the smoothed reference FA image. Red areas have a significance of p<0.01, green areas have a significance of p<0.05. The slices displayed contain representative anatomical structures. Slice locations are shown in the T1 weighted images in the right. (A) Coronal slices from anterior to posterior. (B) Axial slices from superior to inferior.

