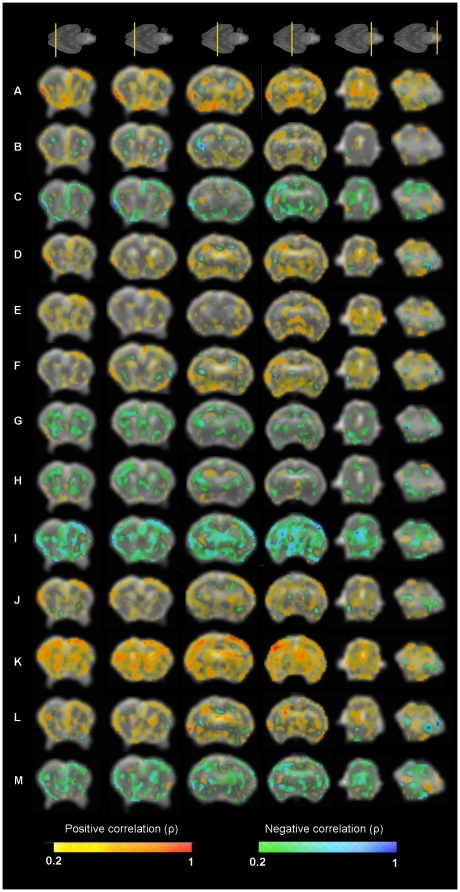
Figure 5. Correlation maps between neurobehavioral test items and fractional anisotropy values.
Coronal slices (from anterior to posterior) of the smoothed reference FA image. Colormap highlights the areas where the correlation coefficient is higher than 0.2. (A) Posture, (B) Righting reflex, (C) Tone, (D) Locomotion, (E) Circular motion, (F) Intensity, (G) Duration, (H) Lineal movement, (I) Fore-hindpaw distance, (J) Sucking and swallowing, (K) Head turn, (L) Smelling test, (M) Smelling test time.

