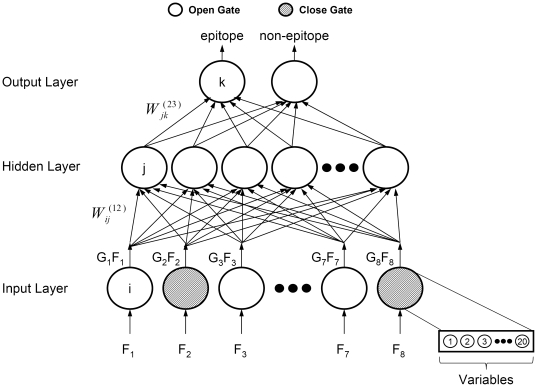
Figure 2. FSMLP network structure.
Eight amino acid propensities are used in the input layer. Each propensity results in 20 normalized amino acid values. Thus the inputs are in 160-dimension. The 20 values corresponding to a particular propensity are treated as a group. The algorithm selects one or more propensities to evaluate its or their performance. After the training is over, the GFSMLP reports the most useful propensity/propensities to classify the input peptide sequence belonging to epitopes or non-epitopes in the output layer.

