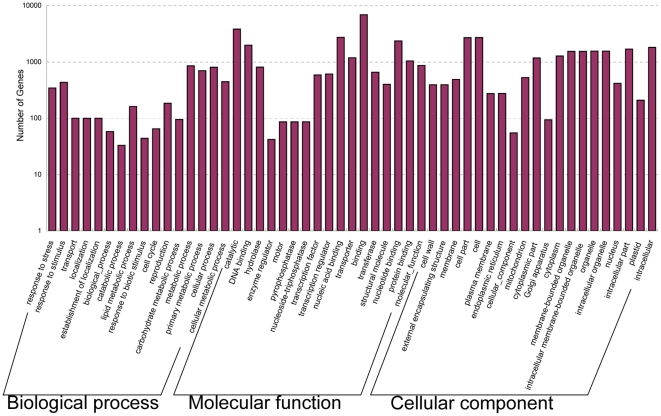
Figure 3. Histogram presentation of gene ontology (GO) classification.
The results are summarized in three main categories: biological process, molecular function and cellular component. The y-axis indicates the number of genes in a category. In three main categories of GO classification, there are 16, 17, and 20 functional groups, respectively. Metabolic process (GO: 0008152), with 851 genes, are dominant in the main category of biological process. Binding (GO: 0005488) and cell part (GO: 0044464) consisted of 6892 and 2688 genes, are dominant in the main categories of molecular function and cellular component, respectively.

