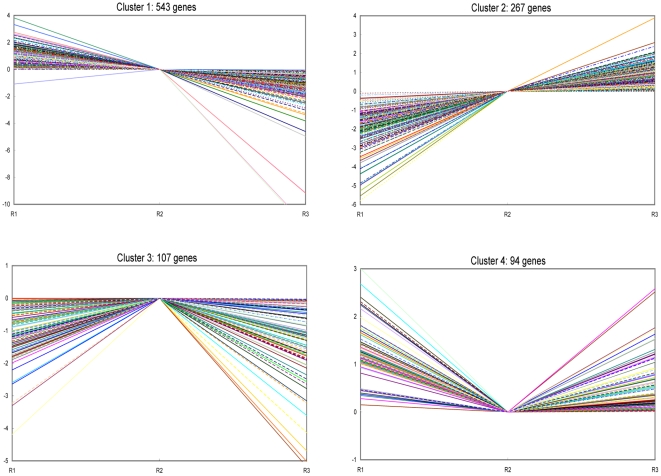
Figure 7. Expression patterns in the four expression clusters.
Clusters were obtained by the k-means method on the gene expression profiles of the 1011 modulated genes. R1, 3–5 DAP; R2, 7 DAP; R3, 14 DAP. The most abundant group is Cluster 1, with 543 genes whose expression shows a negative slope during embryogenesis. The second abundant group is Cluster 2, which contained 267 genes whose expression shows a positive slope from 3 to 14 DAP. Cluster 3 is composed of 107 genes that begin to up-regulate at 3–5 DAP, peak at 7 DAP, and decrease thereafter. Cluster 4 consisted of 94 genes that are down-regulated from 3–5 to 7 DAP, then up-regulate to 14 DAP. Their identities and expression clusters are listed in Table S4.

