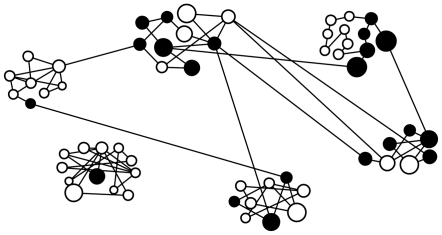
Figure 2. An association network of male elephants showing a strong community structure (Modularity, Q = 0.729).
The nodes represent 58 individual male elephants and the size of the node is proportional to age of an individual male. Black circles (nodes) indicate raiders and the white circles indicate non-raiders. Nodes are grouped into six clusters using the Girvan-Newman algorithm in NetDraw. Clusters in the top row from left, center and right are identified as A, B and C respectively and clusters in the bottom row are identified as D, E, F from left, center and right respectively.

