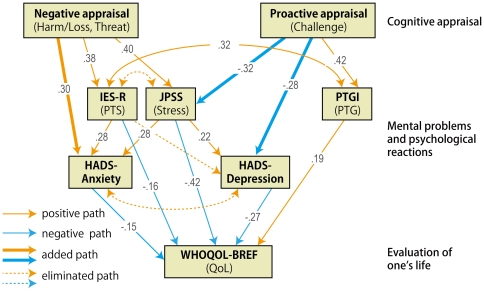
Figure 3. Model 1 with QoL as a final outcome after modifications.
This model exhibited a higher and more sufficient goodness of fit, and thus may better represent the psychological adaptation process after the earthquake. One-headed arrows indicate the direction of observed regression. Two-headed arrows indicate observed correlation, with error components being omitted for simplicity. Additional observed paths are indicated as bold-lined arrows, and unsupported paths are shown as dotted-lined arrows. The numbers on the arrows represent regression coefficients.

