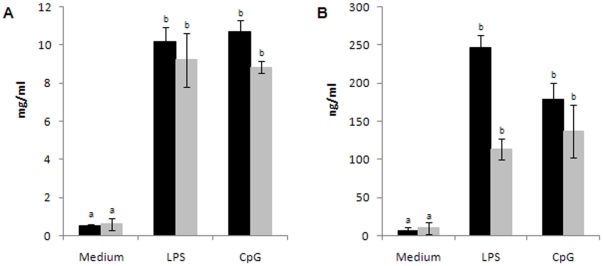
Figure 2. Spleen cells from well-nourished control (WNC) (black bars) and malnourished control (MNC) (grey bars) mice were cultured with medium, LPS or CpG.
Total concentration of IgM (A) or IgG (B) in culture supernatants was determined by ELISA. a,b Means in a bar with different letters (a>b) were significantly different (p<0.01).

