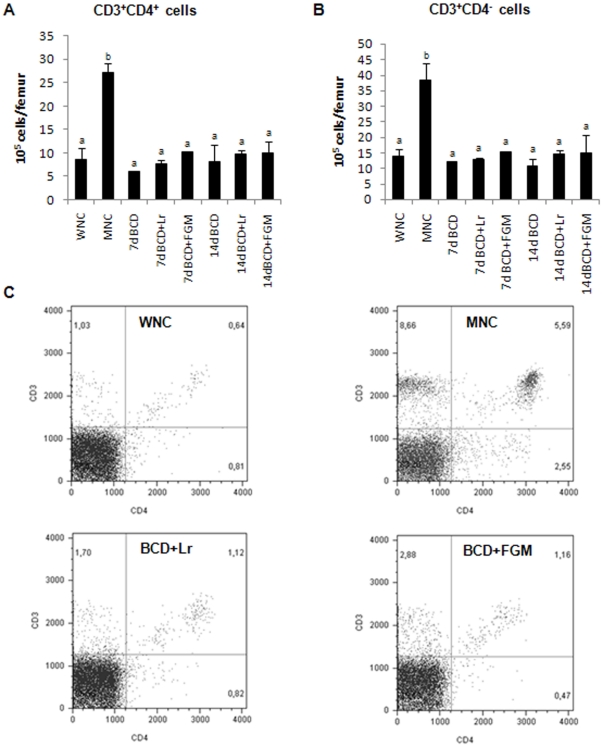
Figure 5. BM cells from malnourished mice replete for 7 days with a balanced conventional diet (BCD) with supplemental Lactobacillus rhamnosus (BCD+Lr) or fermented goat milk (BCD+FGM) were stained with fluorochrome labeled anti-mouse CD3 and anti-mouse CD4 antibodies and analyzed by flow cytometry.
Well-nourished control (WNC) and malnourished control (MNC) mice were used as controls. A. Number of CD3+CD4+ cells. B. Number of CD3+CD4− cells is reported. a,bMean values within a column with unlike superscript letters were significantly different (p<0.05). C. Representative plots of CD3 vs CD4 expression, gated on lymphocytes, are depicted. Results are representative of two independent experiments, n = 6 samples per group.

