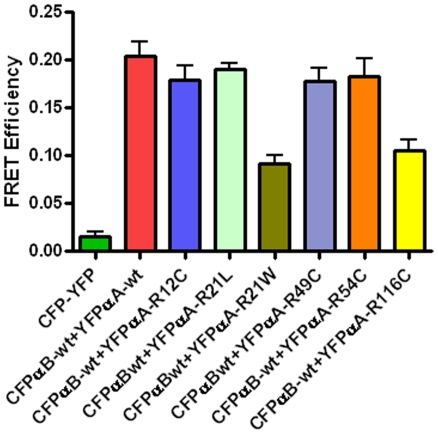
Figure 4. Bar diagram showing the level of FRET efficiency.
FRET efficiency demonstrates the interaction between the αA and αB subunits of α-crystallin. The interaction was strong between the wild-types of αA and αB subunits. The interaction between the mutated constructs, αA-R21W and αA-R116C with αB-wt was lower to αAwt+αBwt and also lower to other mutants group. The results were expressed as mean ± SD. Two-tailed unpaired Student's t-test was used and the p value for αB-wt+αA-R21W is <0.001 and for αB-wt+αA-R116C is <0.0008 compared to αB-wt+αA-wt group.

