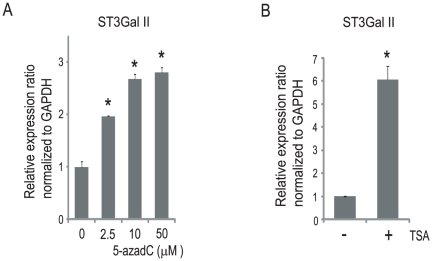
Figure 3. Epigenetic regulation of ST3Gal II in LNCap cells.
(A) LNCap cells were treated with 5-aza-2′-deoxycytidine (5-azadC) (0–50 µM) for 120 h, by refeeding with fresh medium with or without 5-azadC at 72 h. The quantitative real-time PCR analyses for ST3Gal II were performed, and the expression levels are reported as the means ± S.E. (n = 3) of the fold difference in mRNA after normalizing the values to the expression level of untreated cells. *P<0.05. (B) LNCap cells were treated with 5 µM trichostatin A (TSA) for 48 h. The quantitative real-time PCR analyses for ST3Gal II were performed, and the expression levels are reported as the means ± S.E. (n = 3) of the fold difference in mRNA after normalizing the values to the expression level of untreated cells. *P<0.05.

