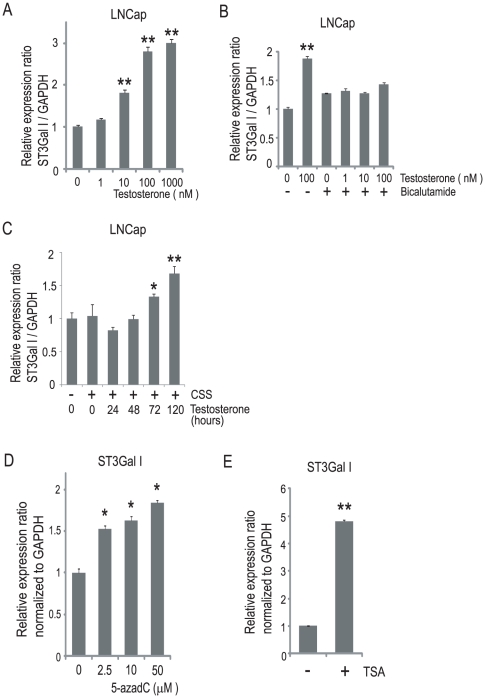
Figure 5. Androgen-dependent and epigenetic regulation of ST3Gal I in LNCap cells.
(A) LNCap cells were treated with or without testosterone (0–1000 nM) for 120 h, by refeeding with fresh medium with or without testosterone at 72 h. The quantitative real-time PCR analyses for ST3Gal I were performed, and the expression levels are reported as the means ± S.E. (n = 3) of the fold difference in mRNA after normalizing the values to the expression level of untreated cells. **P<0.001. (B) LNCap cells were treated with or without testosterone (0–100 nM) and simultaneously with or without 10 µM bicalutamide for 120 h, by refeeding with fresh medium with or without testosterone and/or bicalutamide at 72 h. The quantitative real-time PCR analyses for ST3Gal I were performed, and the expression levels are reported as the means ± S.E. (n = 3) of the fold difference in mRNA after normalizing the values to the expression level of untreated cells. **P<0.001. (C) LNCap cells were incubated in charcoal-stripped serum (CSS) for 48 h and then treated with 100 nM testosterone for the indicated times. The quantitative real-time PCR analyses for ST3Gal I were performed, and the expression levels are reported as the means ± S.E. (n = 3) of the fold difference in mRNA after normalizing the values to the expression level of untreated cells. *P<0.05, **P<0.001. (D) LNCap cells were treated with 5-aza-2′-deoxycytidine (5-azadC) (0–50 µM) for 120 h, by refeeding with fresh medium with or without 5-azadC at 72 h. The quantitative real-time PCR analyses for ST3Gal I were performed, and the expression levels are reported as the means ± S.E. (n = 3) of the fold difference in mRNA after normalizing the values to the expression level of untreated cells. *P<0.05. (E) LNCap cells were treated with 5 µM trichostatin A (TSA) for 48 h. The quantitative real-time PCR analyses for ST3Gal I were performed, and the expression levels are reported as the means ± S.E. (n = 3) of the fold difference in mRNA after normalizing the values to the expression level of untreated cells. **P<0.001.

