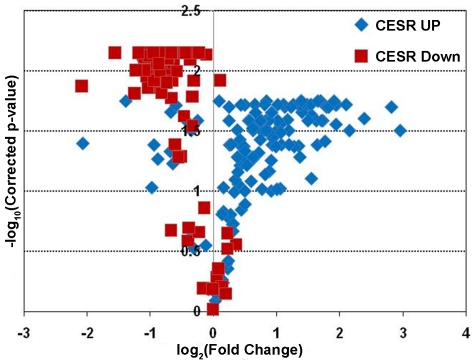
Figure 6. The core environmental stress response genes (CESR) respond to LatA treatment in wild-type cells.
Volcano plot analysis of the expression of the CESR genes in wild-type strains treated with 0.5 µM LatA. Blue diamonds represent CESR genes normally up-regulated in response to multiple stresses. Red squares represent CESR genes normally down-regulated in response to multiple stresses.

