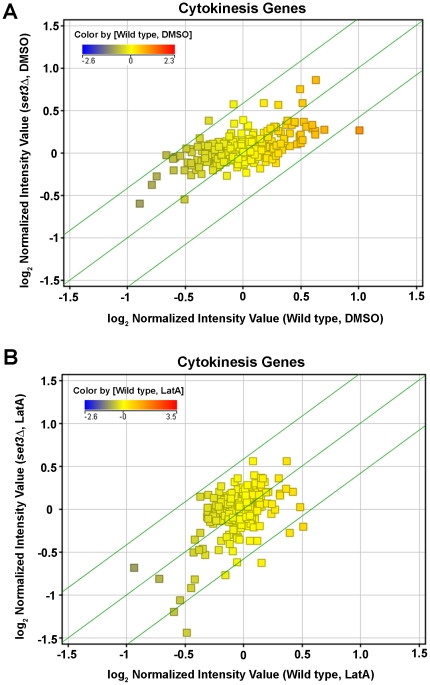
Figure 7. The expression levels of cytokinesis related genes are not differentially regulated.
(A) Cells of the indicated genotypes were grown to mid-log phase at 30°C in YES, and then treated with DMSO (A) or 0.5 µM LatA (B) for 3 hours. Total RNA was extracted and used in expression profiling using Affymetrix Yeast 2.0. Genechips. Graphs shows scatter plot analysis comparing the expression of cytokinesis related genes in wild-type and set3Δ strains. Green lines represent the threshold for a 1.5 fold change in transcript levels. The color of the squares indicates the level of expression of that gene in DMSO (A) or LatA (B) treated wild-type cells.

