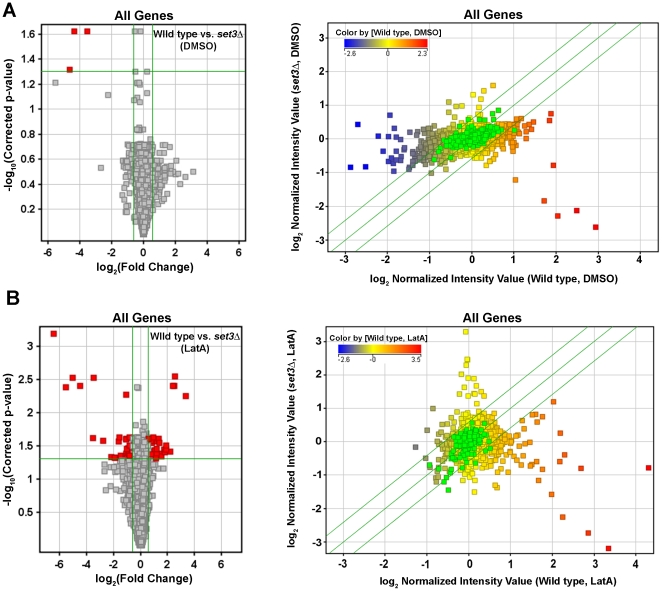
Figure 8. Identification of S. pombe genes differentially expressed with respect to genotype.
Volcano plot (left panels) and scatter plot (right panels) analysis of the expression of all S. pombe genes in DMSO (A) or LatA (B) treated cells of the indicated genotype. Horizontal green lines in volcano plots represent a p-value of 0.05. Vertical green lines in volcano plots represent threshold for a 1.5 fold change in expression. Red squares in volcano plots indicate differentially expressed genes. Diagonal green lines in scatter plots represent the threshold for a 1.5 fold change in expression. The color of the squares in scatter plots indicates the level of expression of that gene in DMSO (A) or LatA (B) treated wild-type cells.

