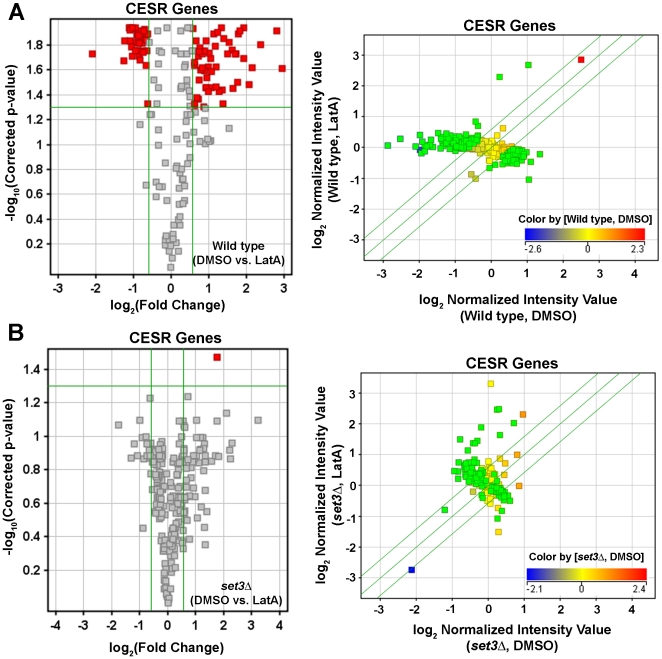
Figure 9. set3Δ mutants are impaired in their ability to modulate the expression of CESR genes in response to LatA treatment.
Volcano plot (left panels) and scatter plot (right panels) analysis of the expression of CESR genes in wild-type (A) or set3Δ (B) strains in response to LatA treatment. Horizontal green lines in volcano plots represent a p-value of 0.05. Vertical green lines in volcano plots represent threshold for a 1.5 fold change in expression. Red squares in volcano plots indicate differentially expressed genes. Diagonal green lines in scatter plots represent the threshold for a 1.5 fold change in expression. The color of the squares in scatter plots indicates the level of expression of that gene in DMSO treated wild-type (A) or set3Δ (B) cells. Genes differentially expressed upon LatA treatment in wild-type cells are shown as green squares in scatter plots.

