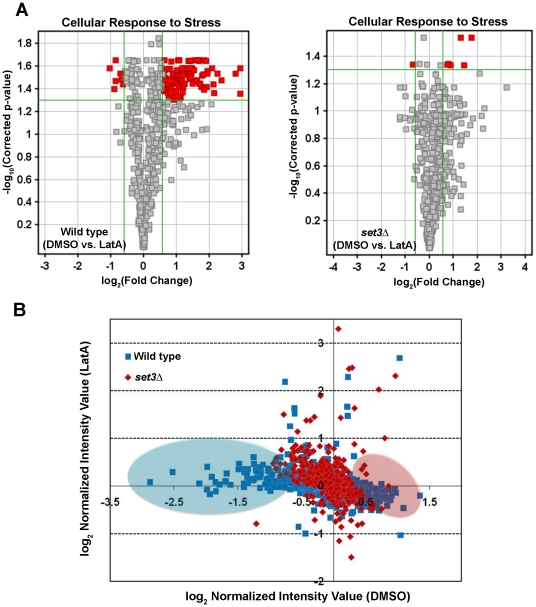
Figure 10. set3Δ mutants are impaired in their ability mount a proper transcriptional response to LatA treatment.
(A) Volcano plot analysis of the expression of genes annotated by GO as having a cellular response to stress. The response of wild-type cells (left panel) and set3Δ mutants (right panel) treated with LatA are shown. Horizontal green lines represent a p-value of 0.05. Vertical green lines represent the threshold for a 1.5 fold change in expression. Red squares indicate differentially expressed genes. (B) Scatter plot analysis comparing the expression of stress response genes (both CESR genes and genes annotated by GO as having a cellular response to stress) in response to LatA treatment. Blue squares indicates data points for wild type cells. Red diamonds indicate data points for set3Δ mutants. Genes up-regulated in response to LatA in wild-type cells are highlighted with a blue oval. Genes down-regulated in response to LatA in wild-type cells are highlighted with a pink oval.

