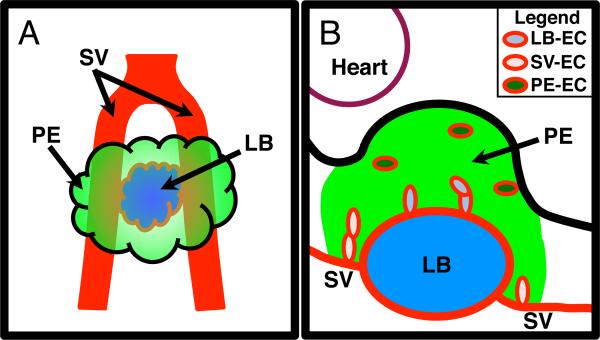
Figure 1.
A Illustration displaying the relative location of the PE in comparison to the LB and the SV. Ventral diagram of an E9.5 mouse PE with the PE depicted in green, the SV in red, and the LB in blue. B Illustration displaying the different populations of EC within the mouse E9.5 PE. Depiction of a sagittal section of an E9.5 mouse PE with the green area signifying the PE region, based on WT1 expression. Blue signifies the developing LB. Heart is located in the upper left demarked by a maroon line. Red line demarks EC and vessels. Light blue ovals depict EC associated with the LB (LB-EC), pink ovals depict EC associated with SV (SV-EC) and dark green ovals depict EC not associated with the SV or LB (PE-EC).

