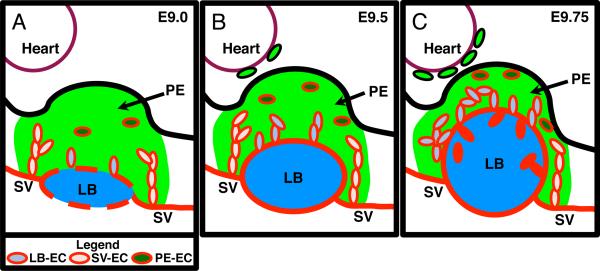
Figure 5.
Schematic model of EC involvement in the developing mouse. Individual panels depict sagittal sections of A E9.0, B E9.5 and C E9.75 mouse PEs. See Figure 1B for description of symbols and colors. A In E9.0 PE, angioblasts within the PE and on the surface of the LB begin to differentiate into EC. EC from the SV migrate into the PE and provide the majority of EC to the PE. B In E9.5 PE, the LB is expanding and is now fully surrounded by EC and there is an increase in LB-EC however SV-EC is still the largest population of EC in the PE. WT1 positive PE cells begin to migrate to the surface of the heart. C In E9.75, the LB has greatly expanded into the PE. The LB is now the largest contributor of EC within the PE.

