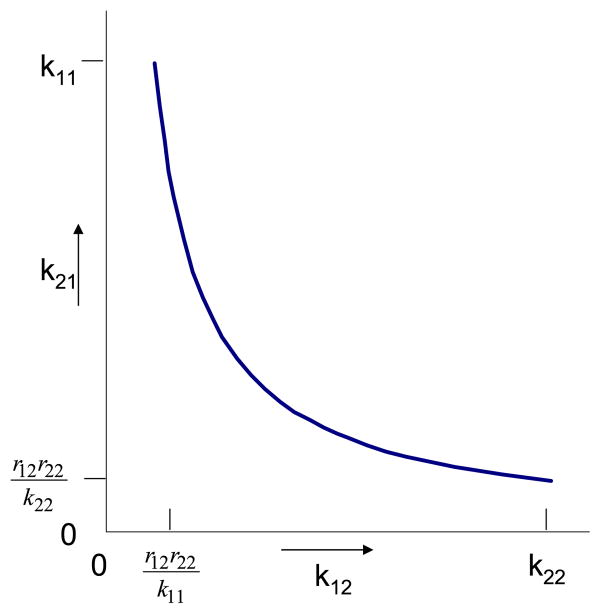
Fig. 5.
For the structure in Fig. 4, the curve, a rectangular hyperbola, shows how k12 and k21, two unidentifiable parameters in the activity model, vary together. Their product is fixed (equal to the product r12r22). The smallest and largest values possible for each are indicated on the axes.

