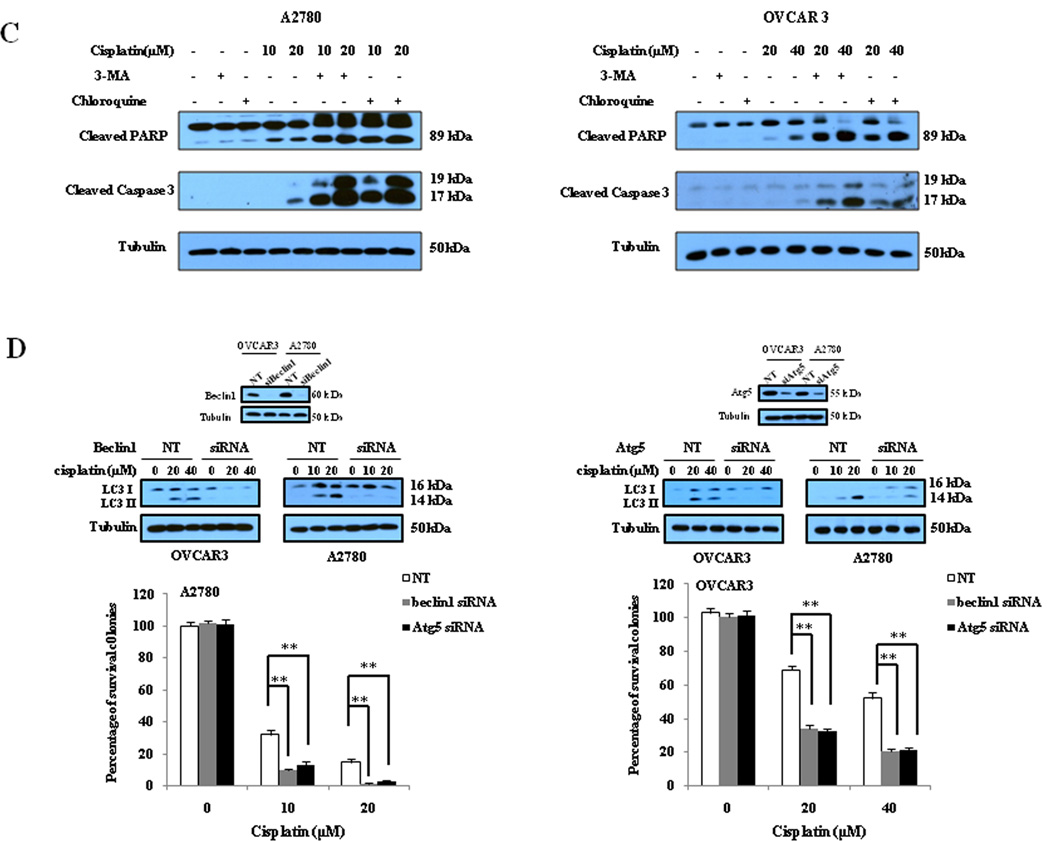
Figure 2. Inhibition of autophagy by 3-MA and chloroquine enhances sensitivity of ovarian cancer cells to cisplatin.
(A) Upper panels: A2780 and OVCAR3 cells were treated with the indicated concentrations of cisplatin for 48 h in the presence or absence of 3-MA (2mM) or chloroquine (2.5µM). At the end of treatment, cell viability was measured by MTT assay; Lower panels: A2780 and OVCAR3 cells were treated with the indicated concentrations of cisplatin for 24 h in the presence or absence of 3-MA (2mM) or chloroquine (2.5µM), then plated in 35-mm cell culture dishes and incubated for 10 days at 37°C in a humidified atmosphere containing 5% CO2/95% air. At the end of incubation, colonies were stained with 1% methylene blue in 50% methanol for 30 min, washed with water, and colonies counted. Each point or bar represents mean ± S.D. of triplicate determinations; results shown are the representative of three identical experiments. *p<0.05; **p<0.01; (B and C) A2780 and OVCAR3 cells were treated with the indicated concentrations of cisplatin for 24 h in the presence or absence of 3-MA (2 mM) or chloroquine (2.5 µM). Apoptosis was determined by: (B) flow cytometric analysis of Annexin V staining; and (C) Western blot analysis of PARP and cleaved caspase-3. (D) A2780 and OVCAR3 cells were transfected with a beclin 1-targeted or Ag5-targeted siRNA; forty-eight h later, the cells were treated with the indicated concentrations of cisplatin for 24 h, then plated in 35-mm cell culture dishes and incubated for 10 days at 37°C in a humidified atmosphere containing 5% CO2/95% air. At the end of incubation, colonies were stained with 1% methylene blue in 50% methanol for 30 min, washed with water, and colonies counted. The bars are the mean ± S.D. of triplicate determinations; results shown are the representative of three identical experiments. *p<0.05; **p<0.01, vs. control, t-test.


