
Figure 1. Forest plot of study-specific ORs and 95% CIs for the association between history of diabetes and HNC risk, INHANCE Pooled Case-Control Study of Head and Neck Cancer.
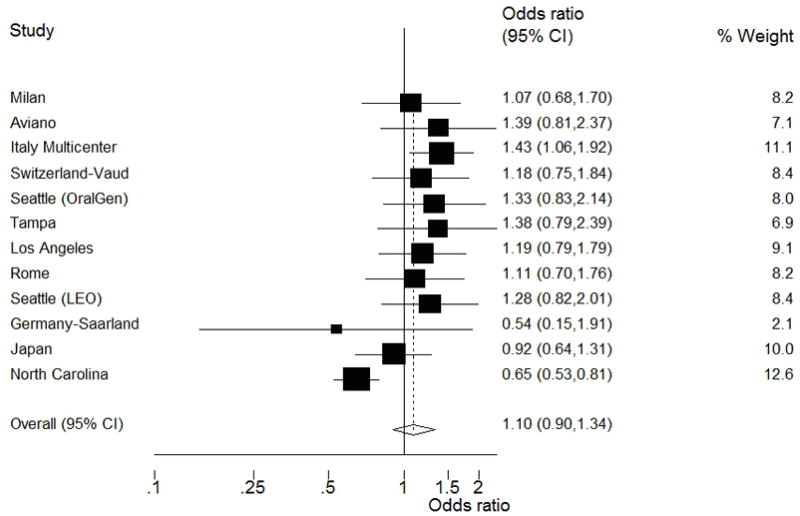
The squares represent the OR estimates and the horizontal lines represent the 95% CIs for each study. The area of the square reflects the weight that the study contributes. This random-effects model incorporates an estimate of between-study heterogeneity in the weighting. The diamond at the center indicates the random-effects estimate and the width of the diamond indicates the 95% CI.