Abstract
The interaction between synthetic polymer nanoparticles (NPs) and biomacromolecules (e.g. proteins, lipids and polysaccharides) can profoundly influence the NPs fate and function. Polysaccharides (e.g. heparin/heparin sulfate) are a key component of cell surfaces and the extracelluar matrix and play critical roles in many biological processes. We report a systematic investigation of the interaction between synthetic polymer nanoparticles and polysaccharides by ITC, SPR and an anticoagulant assay to provide guidelines to engineer nanoparticles for biomedical applications. The interaction between acrylamide nanoparticles (~30 nm) and heparin is mainly enthalpy driven with submicromolar affinity. Hydrogen bonding, ionic interactions and dehydration of polar groups are identified to be key contributions to the affinity. It has been found that high charge density and cross linking of the NP can contribute to high affinity. The affinity and binding capacity of heparin can be significantly diminished by an increase in salt concentration while only slightly decreased with an increase of temperature. A striking difference in binding thermodynamics has been observed when polymer nanoparticle’s main component is changed from acrylamide (enthalpy driven) to N-isopropylacryalmide (entropy driven). This change in thermodynamics leads to different responses of these two types of polymer NPs to salt concentration and temperature. Select synthetic polymer nanoparticles have also been shown to inhibit protein-heparin interactions and thus offer the potential for therapeutic applications.
INTRODUCTION
The introduction of nanoparticles (NPs) in the biological milieu exposes them to biological macromolecules, including proteins/ peptides, polysaccharides and lipids. The nature of these NP-biomacromolecule interactions can profoundly influence the NPs fate and function.1 The study of these interactions therefore is of fundamental importance. Major efforts have focused on nanoparticle-protein interactions.2 The interaction of acrylamide based NPs with common serum proteins was found to result in their rapid association with proteins to form what has been referred to a “protein corona”.3 Over time the low affinity and more abundant proteins may be replaced by the high affinity and less abundant proteins. The results of these studies add challenges to the design of functional nanoparticles and an additional level of complexity to understanding their behavior in biological systems.
A less well-studied area is that of NP- polysaccharide interactions. Polysaccharides are a key component of the extracelluar matrix and are present on cell surfaces.4 One common family is the glycosaminoglycans (GAG) (e.g. heparan sulfate/heparin, chondriotin sulfate and demetern sulfate).5 GAGs are polyanionic linear polysaccharides that interact with a large number of proteins and mediate many biological events.6 These proteins include antithrombins, growth factors, chemokines, and virus coat proteins. Polysaccharide-protein interactions mediate cell growth, inflammation, coagulation and virus entry. There is a substantial literature on the interaction of nanoparticles decorated with carbohydrates with biological systems.7 However, since polymer nanoparticles are being developed for drug and gene delivery, bioimaging, sensors and as plastic antibodies8, it is noteworthy there is little information about synthetic polymer NP-polysaccharide interactions. The interaction between nanoparticles and cell surface polysaccharides (e.g. endothelial cells and blood cells) may be involved in nanoparticle uptake by cells through endocytosis.9 For example, recent evidence suggests dual roles of heparan sulfate in NP-mediated gene delivery. Heparan sulfate can bind to the NP-DNA complex and serve as a key cell entry factor for gene delivery. Interestingly, heparin sulfate may also cause the release of DNA and inhibition of gene transfection.10 On the other hand, the biological functions of polysaccharides may be compromised by binding to NPs. This can lead to serious and unintended side effects resulting from the use of NP delivery vectors. However, it may also open up possibilities for new therapeutic applications of NPs for mediating polysaccharide-protein interactions. For therapeutic applications, an understanding of the fundamentals of nanoparitlce- polysaccharide interactions can provide guidelines for engineering synthetic polymer nanoparticles with a minimum of side effects. We report a study of the thermodynamics of NP-polysaccharide binding, the influence of NP composition and external factors (e.g. temperature, pH and salt concentration) on binding and the possible role of NP inhibition of polysaccharide- protein interactions. Acrylamide and N-isopropylacrylamide-based polymer nanoparticles were chosen as models for this study due to their widespread use in biomedical research as drug and gene carriers, as probes and as “plastic antibodies.11The following is a systematic study of synthetic polymer NP-polysaccharide interactions using isothermal titration calorimetry (ITC), surface plasmon resonance spectroscopy (SPR) and an anticoagulation assay.
RESULTS AND DISCUSSION
Nanoparticle Library
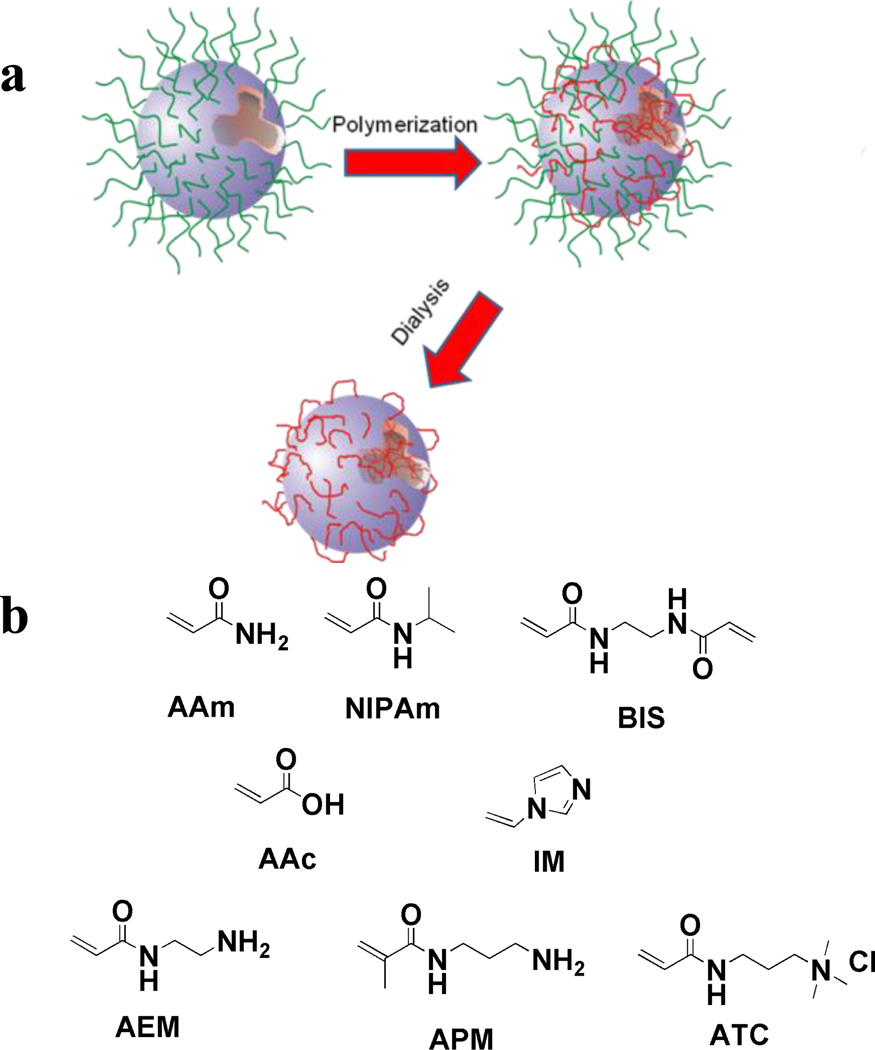
A small library of water soluble acrylamide-based polymer nanoparticles was synthesized by inverse microemulsion polymerization (Fig. 1a).12 The nanopartilces were prepared by copolymerization of combinations of functional monomers that included acrylamide (AAm) (hydrogen bonding donor and acceptor), ethylene-bis-acrylamide (BIS) (crosslinker), acrylic acid (AAc) (negative charge) and aminopropylmethacrylamide (APM), aminoethylacrylamide (AEM), (3-acrylamidopropyl) trimethyl ammonium chloride (ATC) and 1-vinyl imidazole (IM) (positive charged monomers) (Fig. 1b). Following polymerization, nanoparticles were extensively dialyzed against EtOH and then water for 1 week to remove surfactants and oligomers. All nanoparticles displayed good stability in PBS buffer and had average diameters of approximately 30 nm (Table 1).
Figure 1.
a) Schematic of NP preparation by microemulsion polymerization: The aqueous monomer solution (the blue droplet) is dispersed in hexane and the nanodroplets are stabilized by a layer of surfactants (green). Monomers polymerize to form nanoparticles (red) upon addition of initiator. Dialysis against ethanol and water is employed to remove surfactants. b) Monomers (and their abbreviations) used in the preparation of the NP library The library is composed of neutral, negatively charged and positively charged NPs.
Table 1.
Summary of NP composition and size (DLS)
| Entry | AAm | BIS | AAc | ATC | APM | IM | AEM | Size |
|---|---|---|---|---|---|---|---|---|
| #1 | 90 mol% | 10 mol% | 35 nm | |||||
| #2 | 85 mol% | 10 mol% | 5 mol% | 30 nm | ||||
| #3 | 87 mol% | 10 mol% | 2mol% | 28nm | ||||
| #4 | 85 mol% | 10 mol% | 5 mol% | 28 nm | ||||
| #5 | 80 mol% | 10 mol% | 10mol% | 28 nm | ||||
| #6 | 87 mol% | 10mol% | 2mol% | 30 nm | ||||
| #7 | 85 mol% | 10 mol% | 5 mol% | 30 nm | ||||
| #8 | 85mol% | 10 mol% | 5 mol% | 34 nm | ||||
| #9 | 85mol% | 10mol% | 5mol% | 50nm | ||||
| #10 | 93mol% | 5mol% | 2mol% | 30nm | ||||
| #11 | 98mol% | 0mol% | 2mol% | –* |
data quality is poor presumably due to swelling of the polymer
ITC Study of the Nanoparticle-Heparin Interactions
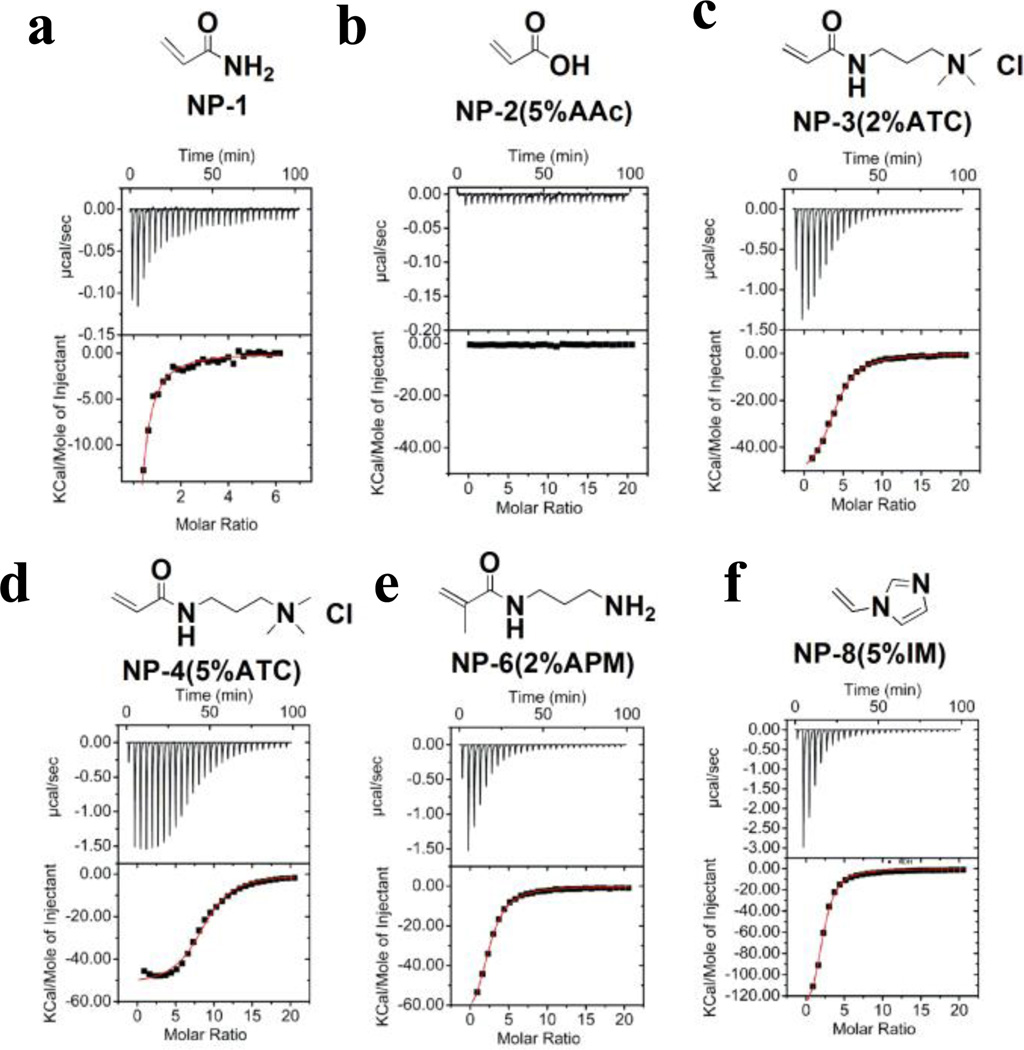
The direct determination of thermodynamic parameters of NP-carbohydrate binding was obtained by ITC.13 Ligand is titrated into a NP receptor solution by a series of injections. The heat generated is recorded and plotted against ligand concentration. Representative titrations of nanoparticle-heparin interactions are shown in Figure 2a. The upper graphs show the titration curve. Heat is generated upon injection of a solution of ligand in the syringe into the cell. The lower graphs are the integral of the titration curve. With curve fitting, the affinity (Ka), enthalpy change (ΔH) and stoichiometry (N: average ratio of ligand to receptor) can be calculated.
Figure 2.
ITC Study of Heparin-NP Interaction. Heparin (0.1 mM) in 10 mM PBS was titrated into 1mg/mL of a) NP–1 (10% BIS, 90% AAm); b) NP–2 (5% AAc); c) NP–3 (2% ATC); d) NP–4 (5%ATC); e) NP–6 (2% APM);f) NP–8 (5% IM). For each titration, the upper graph shows the titration curve. In most cases, heat is generated upon injection of the ligand into the cell. The titration curve was integrated in the lower graph and fitted by a single-site model.
Our initial effort focused on the composition of binding forces (e.g. ionic, hydrogen bonding and hydrophobic) underlying the interaction between NPs and heparin. Heparin (~15 kD), a negatively charged polysaccharide, was chosen as a model polysaccharide.
In a typical experiment, 0.1 mM aqueous solution of heparin in 10 mM PBS buffer was injected in equal steps of 10 µL into 1.47 mL of 1~5mg/mL of NP solution. The heat of dilution of the polysaccharide solution added to pure buffer solution in the absence of NP was also determined and subtracted from the enthalpy measured in the titration experiments. We assumed that the surface of the nanoparticle is homogenous. A single-site model therefore was utilized to curve fit the data to provide the Ka, enthalpy and entropy changes and stoichiometry.
The titration data is summarized in Table 2. All NPs, with the exception of the negatively charged NP–2(5%AAc) (Fig. 2b), were observed to bind to heparin and release heat. The negatively charged NP–2(5%AAc) did not exhibit any heat loss or gain upon addition of heparin presumably due to the charge-charge repulsion as heparin is also highly negatively charged. It is interesting to note however that heparin binds to neutral NP–1 (Fig. 2a). As there are no positive charged functional groups on NP–1, ionic interactions are not involved in binding. Since NP-1 is very hydrophilic and hydrophobic interactions are entropy driven at room tempeure,14 we reasoned that hydrophobic interactions are less important for this interaction. Thus, we conclude that the interaction between NP-1 and heparin is mainly due to hydrogen bonding and/or van der Waals interactions.
Table 2.
Themodynamics of NPs-Heparin Interaction.
| Entry | N | Ka (106M−1) | ΔH (kcal/mol) | ΔS (cal/mol/deg) |
|---|---|---|---|---|
| #1(90%AAm) * | 0.40±0.14 | 0.80±0.30 | −51.1±19.8 | −144 |
| #2(5%AAc) | – | – | – | – |
| #3(2%ATC) | 3.86± 0.05 | 1.48± 0.08 | −56.3± 1.0 | −161 |
| #4(5%ATC) | 8.63±0.12 | 2.10±0.25 | −52.7±1.0 | −148 |
| #5(10%ATC) | 16.2±0.28 | 21.1±6.8 | −37.0±1.0 | −91 |
| #6(2%APM) | 2.35± 0.03 | 1.52± 0.05 | −75.4± 1.0 | −225 |
| #7(5%APM) | 8.86± 0.18 | 3.93± 0.56 | −57.9± 2.1 | −164 |
| #8(5%IM) | 1.99±0.05 | 2.25±0.2 | −154.3±5.7 | −489 |
| #9(5%AEM) | 3.18±0.03 | 1.64±0.06 | −97.4±1.2 | −298 |
| #10(5%BIS) | 5.03± 0.08 | 1.11± 0.07 | −60.1± 1.3 | −174 |
| #11(0%BIS) | 7.91± 0.3 | 0.25± 0.03 | −51.9± 2.6 | −149 |
Curve fitting of the data for the NPs is poor.
Strong interactions were observed between heparin and all positively charged NPs (NP–3~NP–9, Fig.2c–2f). In order to understand these interactions in more detail, titrations were run at various temperatures and salt concentrations. The binding energy is typically composed of two parts: ionic and nonionic interactions. Nonionic interactions include hydrogen bonding, hydrophobic interactions and van der Waals forces. Heparin is a highly negatively charged polyelectrolyte. According to polyelectrolyte theory15, sodium cations are associated with the heparin polymer to reduce charge repulsion within the heparin polymer chain. The binding of added cationic species (e.g. protein or positively charged NPs 3–9) will release sodium cations from the heparin polymer. This process is accompanied by a positive entropy change.
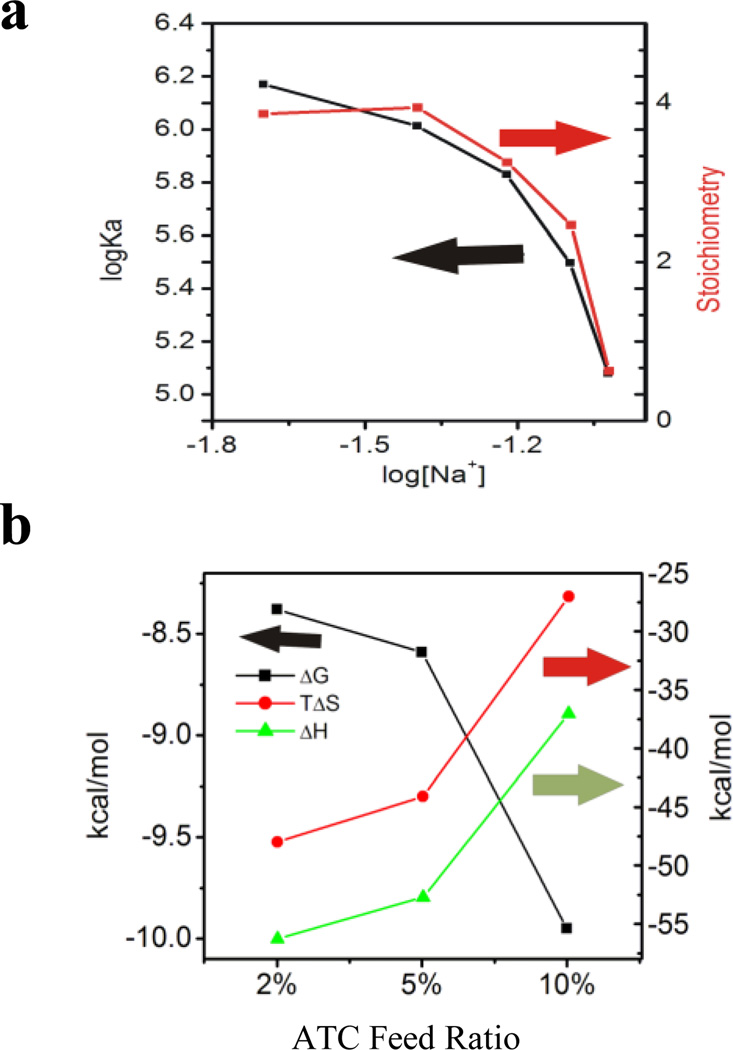
For protein-heparin interactions, a plot of the log of the association constant versus the log of the sodium ion concentration gives a straight line from whose intercept the percentage of ionic interaction can be derived. 16 In our case (NP–3, for example), the line is curved as shown in Fig. 3a. Therefore, the percent contribution of ionic interaction to the binding cannot be determined. Along with the curve linear relationship, we also observe a drop in stoichiometry with an increase of salt concentration. This may imply a change in binding mechanism over the concentration (ionic strength) range studied..It is reported that the conformation of polyacrylamide is sensitive to dissolved salt.17 One possible reason for the observed drop instoichiometry is the change in the microenvironment of polyacryalmide binding sites. In addition, the first heparin bound to the NP can influence the uptake of subsequent heparin molecules. This negative cooperativity can also result in decrease in stochiometry. 18Nevertheless, operationally; an increase in salt concentration not only decreases the affinity but also the binding stoichiometry of heparin.
Figure 3.
a) The titration of heparin into NP–3(2%ATC) at various salt concentrations: 20 mM, 40 mM, 60 mM, 75mM NaCl. Log Ka (black line) and stoichiometry (N) (red line) from the titrations are plotted against log [Na+]. b) Enthalpy (green line), entropy (red line) and free energy (black line) plot for the interaction of NP–3(2%ATC), NP–4 (5%ATC) and NP–5 (10%ATC) against heparin in 10 mM PBS.
When the charge density (%ATC) of a NP increases (NP–3 (2%ATC) < NP–4 (5%ATC) < NP–5(10% ATC), both the affinity and the stoichiometry increase (Fig. 3b). It is also interesting to note that the change in both enthalpy and entropy decreases with an increase of NP charge density. This is consistent with polyelectrolyte theory. As the charge density increases, the percentage of ionic interaction increases and more sodium cations from heparin are released upon binding to the NP. This contributes to a gain in entropy. The entropy change therefore becomes less negative for NP–5 (10%ATC).
From the ITC experiments, we conclude that ionic contributions play an important role in the positively charged NP-heparin interactions.
In addition to ionic interactions, hydrogen bonding and dehydration from either polar patches or nonpolar patches (hydrophobic interactions) may also contribute to the overall affinities. According to polyelectrolyte theory, when the interaction between heparin and positively charged NPs is driven exclusively by ionic interactions, it is expected that the entropy change should be positive (release of Na ions from heparin). Since for all interactions of positive charged NPs with heparin, the entropy change is negative, nonionic interactions are clearly involved in the binding. This conclusion is also supported by the neutral NP–1-heparin interaction. As all positive charged NPs share a similar polyacrylamide backbone with neutral NP–1, we conclude that hydrogen bonding and/or van der Waals forces is one of the main forces in the binding of heparin to positive charged NPs.
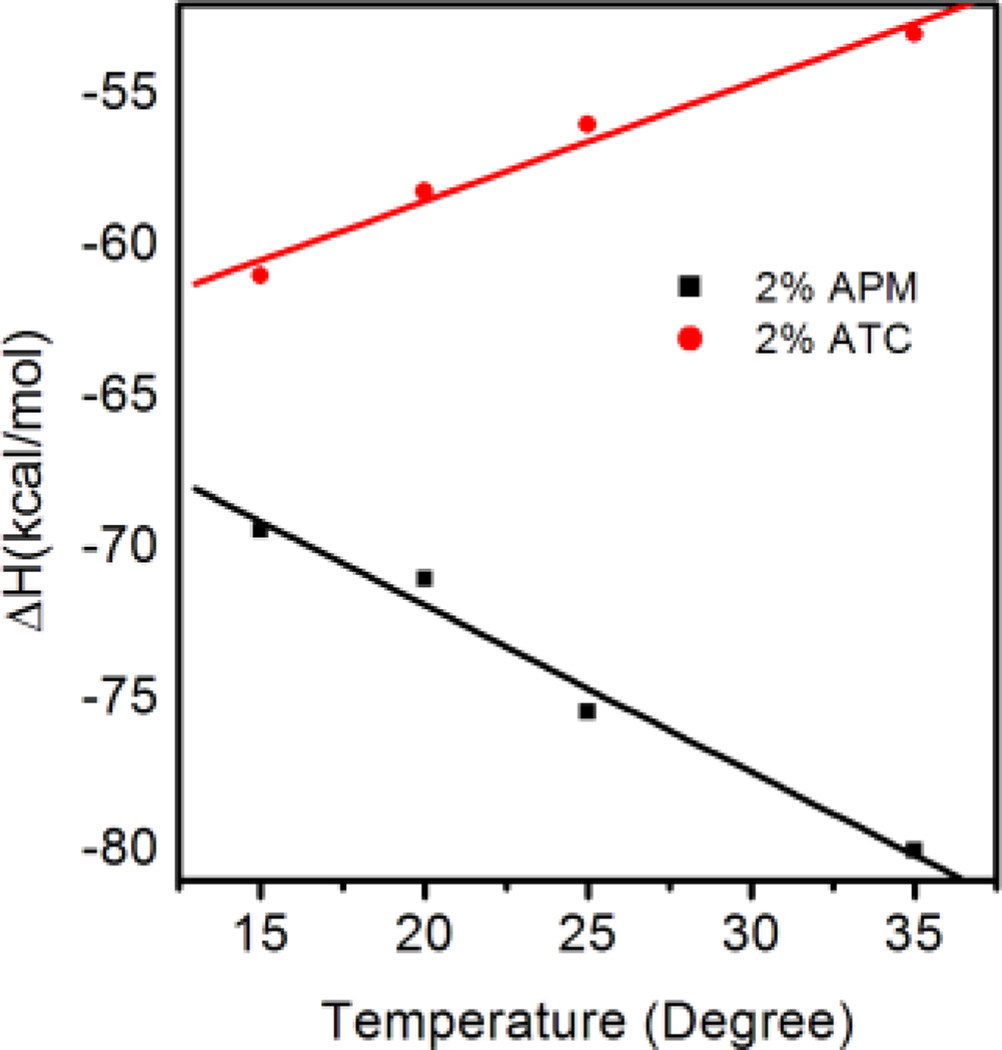
To evaluate the contribution from solvent dehydration upon binding, titrations of heparin into NP–3 (2%ATC) were carried out over a series of temperatures (Fig.3a). Enthalpy changes were plotted against temperature to obtain the heat capacity change. Heat capacity change can be related to water reorganization of the complex.19 A large negative change in heat capacity is typically associated with reduction of exposed hydrophobic domains upon binding. This is due to the fact that the heat capacity of water molecules associated with hydrophobic patches is higher than that of bulk water molecules. On the other hand, a positive change in heat capacity indicates a reduction of exposed polar residues resulting from association of heparin and NPs. For NP–3(2%ATC), the enthalpy change becomes less negative with an increase in temperature. A positive heat capacity change of 0.393kcal/mol/deg was calculated (red line in Fig. 4a) indicating the importance of a reduction of exposed polar groups and a less important role for hydrophobic interactions.
Figure 4.
A plot of the enthalpy change vs temperature from the titration of heparin into solutions (10 mM PBS) of NP–3 (2%ATC) (red line) and NP–6(2%APM) (black line) at different temperatures. The heat capacity changes were calculated from the slopes of the lines.
Interestingly, when the same experiments were performed for NP–6 (2%APM), a negative heat capacity (−0.552 kcal/mol) was calculated (black line in Fig. 4). Since both NP–3(2%ATC) and NP–6(2%APM) are hydrophilic, we exclude the possibility that the negative heat capacity results from burial of hydrophobic patches upon binding of heparin. One difference between NP-3 (2%ATC) and NP-6 (2%APM) is that NP-3 carries permanent charge (quatery amine) and NP-6 carries a primary amine that can be deprotonated. Titrations at different pH show the affinity between heparin and NP-3 does not change throughout the whole pH range (pH4~9) while there is a significant drop in affinity for NP-6 from pH 8–9 (Supporting Information Figure 1). Although the pKa of an isolated primiary amine is high (~10.5), the pKa of the amine in the polymer may be shifted due to neighboring protonated amine groups.20 It has been reported that protonation may hav a significant effect on the heat capacity change. 21 Indeed, the heat capacity change of heparin-NP-6 interaction at acidic pH became positive (Supporting Information Figure 2). This indicates that the heat capacity change of NP-6 is pH dependent and hence the negative heat capacity change at neutral pH is more likely due to the protonation effect instead of a hydrophobic effect. In addition, the difference in protonation upon binding may be one of the reasons why NP–3(2%ATC) and NP–6(2%APM) have significantly different enthalpy and entropy changes upon interacting with heparin. It is clear that the nature of the charged group in the functional monomer can lead to very different energetics of binding.
Overall, hydrogen bonding, ionic interactions and dehydration from polar patches are responsible for the overall binding affinity of positively charged NP-heparin interactions.
Influence of NP composition on Affinity: The Enthalpy-Entropy Compensation Effect
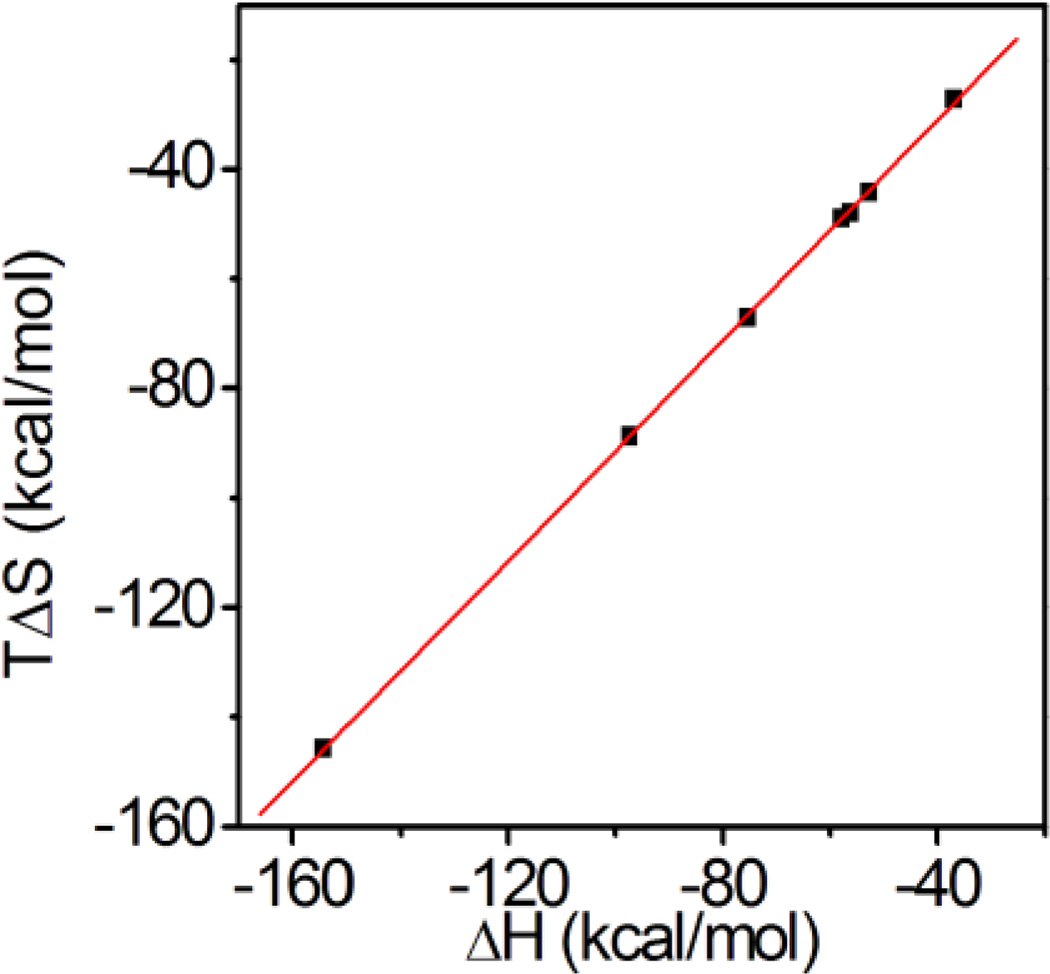
Although the enthalpy and entropy changes for AAm-based (positively) charged NPs (NP 3–9) are significantly different, the affinity (Gibbs free energy) remains almost the same. When plotting entropy change of NP 3–9 against the corresponding enthalpy changes in Table 2, a linear relationship was found (Fig. 5 and equation 1.).This can be attributed to the enthalpyentropy compensation effect22. When the enthalpy change becomes larger, the complex becomes more ordered and hence loses entropy during the interaction. Overall, there is a small change in free energy. The enthalpy-entropy compensation effect has been long established with protein-protein and protein-carbohydrate interactions13. The Rotello group14has reported a similar observation for a functionalized gold nanoparticle-protein interaction. Together with our observation, these results indicate that the enthalpy-entropy compensation effect may be general for NP-biomacromolecule interactions. For the NP-heparin interaction, the slope (α) in equation (1) is calculated to be 0.99 and the intercept (β) is 8.35kcal/mol. In Rotello’s case, the slope was 1.07 with 8.38 kcal/mol intercept. The significant positive slope was attributed to a conformation change of the monolayer protected gold nanoparticle upon complexation with protein. In our case, the slope was slightly lower as nanoparticles are a crosslinked polymer hydrogel. The cross linking may limit the conformational flexibility of polymer. On the other hand, the two intercepts are similar. A large positive intercept indicates that complexation of a nanoparticle and a polysaccharide results in an entropically favored event similar to the complexation of nanoparticles with proteins. This is consistent with the results of our temperature dependent ITC study. However, in contrast to protein-nanoparticle interactions, these entropically favored events may not only include dehydration but also removal of counterions from the polysaccharide.
| (1) |
Figure 5.
The enthalpy-entropy compensation effect for the NPheparin interaction. Entropy changes of the interaction between heprin and NP 3–9 (Table 2) were plotted against the corresponding enthalpy changes. A linear relationship was found.
Influence of NP Crosslinking on the Affinity of the NP-heparin Interaction
Both linear and crosslinked polymers are in common use for biomedical applications.23 We envisioned that crosslinking would limit polymer chain mobility and could influence the polymer NP-biomacromolecule interaction. It is of interest therefore to study the thermodynamic effect of polymer crosslinking on NP-heparin binding. NP–11(0%BIS) and NP–10 (5%BIS) were studied by ITC for comparison with NP–3 with 10% BIS.
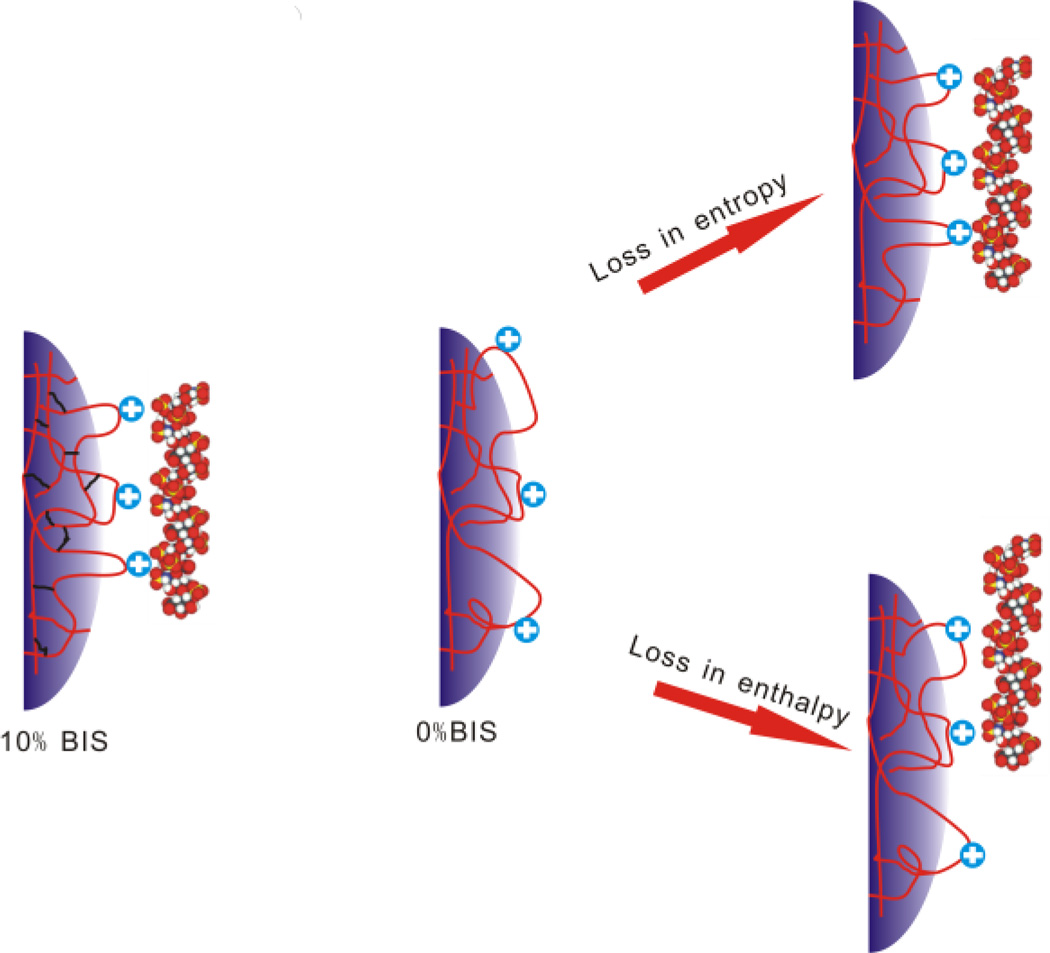
The affinity of the NP-Heparin interaction decreases significantly (~6 fold) as the degree of crosslinking decreases from 10 to 0 mol%. As crosslinking is decreased, polymer chains become more flexible. Flexible polymers may undergo a conformational change to optimize electrostatic interactions (induced fit) but this eventually would evoke an entropy penalty for producing similar binding as 10% BIS NP for heparin molecules. All things being equal, an increase in crosslinking may cluster binding contacts more closely without an entropy penalty (Fig. 6). On the other hand, the number of binding contacts between nanoparticles and a heparin molecule (enthalpy change) may decrease as crosslinking decreases. Either or both decreases in binding contacts or/and the entropic cost may result in diminished affinity as crosslinking decreases. These contributing factors result in no simple trend in enthalpy or entropy change.
Figure 6.
Proposed influence of crosslinking on heparin binding. NPs with 10% BIS are highly crosslinked giving less flexibile polymer chains. Non crosslinked NPs (0% BIS) are highly flexible. Upon binding of heparin the polymer chains will be immobilized evoking an entropy penalty to form the same binding contacts as a 10% BIS NP. Alternatively, the number of binding contacts between nanoparticles and a heparin molecule (enthalpy change) may decrease. Either way, NP affinity will decrease.
On the other hand, nanoparticles with low crosslinking may make accessible more of the NP interior to heparin resulting in a higher capacity. This agrees with the ITC data. As the crosslinking degree decreases from 10% to 0%, the stoichiometry increases from 4 to 8.
These experiments clearly show that the degree of crosslinking has a significant influence on the affinity and capacity of the NPs interactions with heparin and provide a guideline for engineering NPs for specific therapeutic applications.
Thermodynamic Differences between AAm and NIPAm-based NPs
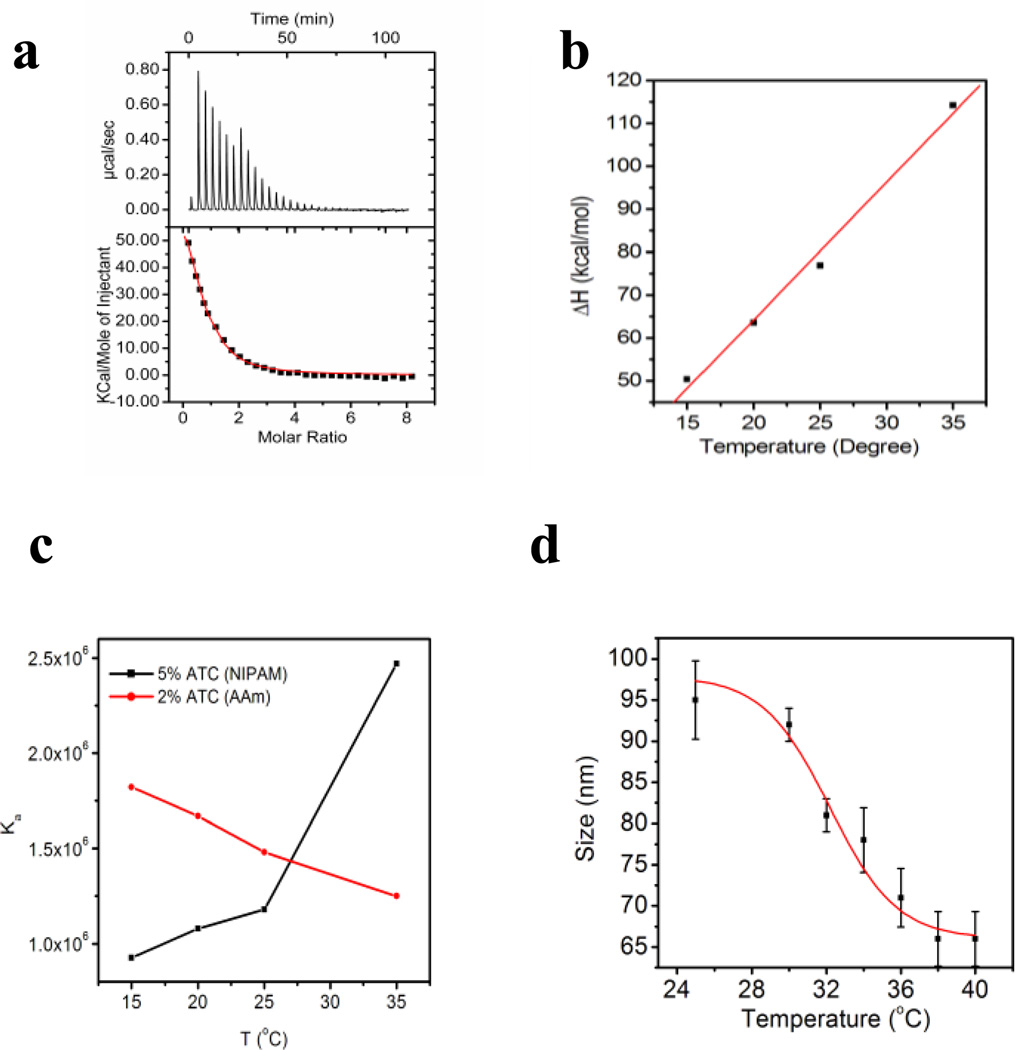
The ability to tailor the composition of synthetic polymer NPs is a strength that allows formulating NPs with variable functions. That variability however presents challenges to draw general guidelines for fabrication of synthetic polymer NPs for therapeutic applications. We have chosen two of the most important monomers used for NP synthesis for this study: acrylamide (AAm) and N-isopropylacrylamide (NIPAm). To compare the thermodynamic response of NIPAm and AAm NPs, a small library of NIPAm-based NPs were prepared by precipitation polymerization (Supporting Information Table 1). The NIPAm NPs were prepared with similar loadings of identical functional monomers so as to permit comparison with AAm NPs. Interestingly, the interaction of NP–13 (5%ATC, NIPAm) and heparin is driven by an entropy change (Fig. 7a). The enthalpy change is unfavorable. From a temperature study, a large positive heat capacity (3 kcal/mol/deg) was found indicating that hydrophobic interactions may not be important (Fig. 7b). Indeed, at a salt concentration of only 40 mM, the interaction was not detectable by ITC (Ka is at least lower than 104M−1). All of the above suggests that ionic interactions play the major role in the NIPAm NPs. These results point to a significant difference from AAm-based NPs.
Fig 7.
a) Titration curve for the NP–13- heparin interaction; b) results of the temperature dependent titration of NP–13 with heparin. c) Affinity change with temperature for NP–3 (red line) and NP–13(black line). d) LCST of NP–13. Size of NP–13 was measured triplicate from 25 to 35 °C. NP contraction was observed and the LCST was estimated to be 32 °C.
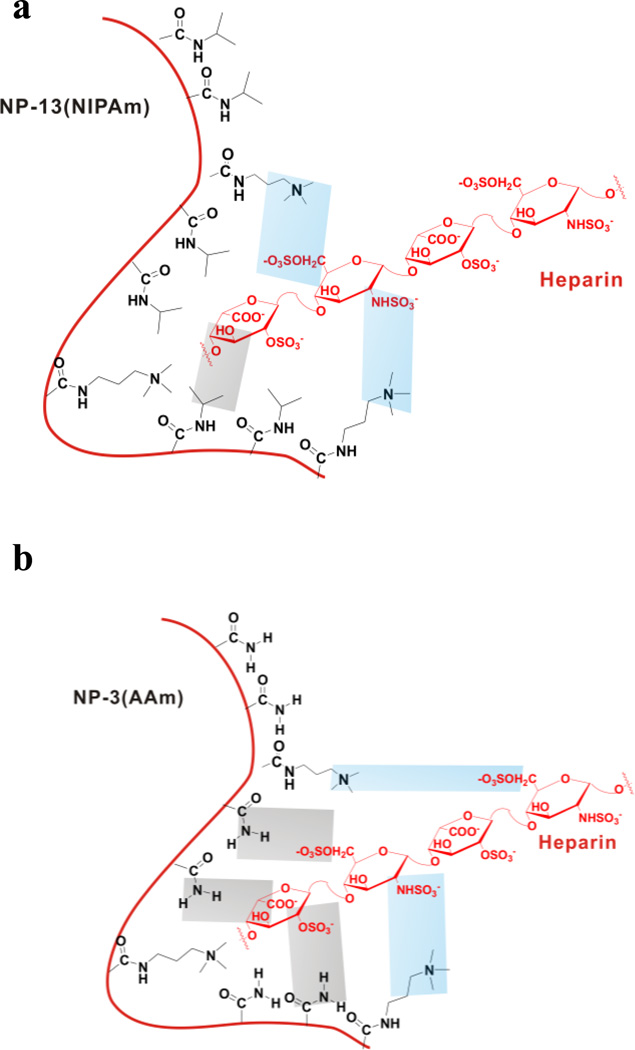
One possible explanation is that AAm based polymers are better hydrogen bonding donor/acceptors than NIPAm based polymers. Therefore, much less hydrogen bonding takes place in the interaction of NP–13 and heparin than that of AAm-based NPs. In contrast, the positive entropy change is attributed to ionic interactions as the most important contributor to heparin binding to NP–13. Dehydration of polar residues may also contribute to the positive entropy change as well as positive enthalpy change, resulting in a positive heat capacity (Fig. 8). This is also supported by comparison of the two neutral NPs: AAm NP–1 and neutral NIPAM NP–12. There is little interaction between neutral NP–12 and heparin. This supports the proposal that hydrogen bonding is not significant for NIPAm-based NPs.
Figure 8.
Possible explanation for the thermodynamic difference between NIPAm and AAm-based NPs. For NIPAm-based NPs (a), ionic interactions (blue area) dominate with little participation of hydrogen bonding (gray area). For AAm-based NPs (b), ionic interactions (blue area) as well as hydrogen bonding (gray area) contribute to binding.
In addition, the heparin affinity of NP–13 increases with an increase in temperature (Fig. 7c). This is fundamentally different from related AAm-based NPs. For NP–3, the heparin affinity decreased from 500 nM to 800 nM when the temperature increased from 15 °C to 35 °C. In contrast, the affinity of NP–11 increases from 1 µM to 400 nM when temperature rises from 15 °C to 35 °C. This can be explained partly by the Van’t Hoff equation (equation 2). Since the interaction is endothermic for NIPAm-based NPs, ΔH/RT2 is positive and Ka therefore increases as T increases. However, the interpretation of data at 35 °C should be handled cautiously. NIPAm polymers have long been known to have a lowest critical solution temperature (LCST), above which polymer chains will collapse due to dehydration of isopropyl groups in polymer.23 We observed a LCST of 32 °C for NP–13 (Fig. 7d). NP–13 contracts from 94 nm to 60 nm between 30°C to 40°C. The high affinity at 35 °C for NP–13 may be due in part to this conformational change.
| (2) |
Overall, these experiments suggest that the thermodynamics of the NIPAm-based NP-heparin interaction are fundamentally different from AAm-based NPs. The origins of this difference reside in the different hydrogen bonding capacities between AAm and NIPAm. These differences can result in significantly different responses to varying ionic strength and temperature. These results demonstrate it is risky to draw similarities even between similar acrylamide polymers and call attention for the need to consider these details when making a choice of polymer for specific biomedical applications.
Influence of Molecular Weight of Heparin on Affinity
Proteins such as ATIII interact with heparin through a specific oligosaccharide sequence.6a In order to understand the binding sequence for NPs, heparins with different molecular weights were studied (Table 3) including the pentamer fondaparinux sodium (~1.7kD), low molecular weight heparin (LMH, ~5kD) and unfractionated heparin (~15kD). It was found that the affinity increases with an increase in molecular weight, which indicates that there is no smallest binding sequence for NPs. Unlike proteins, NPs interact with the full length of heparin through multiple binding sites and hence the affinity is the highest for unfractional heparin (~15 kD).
Table 3.
Thermodynamics of Polysaccharides with NP-3 (2%ATC)
| Entry | Molecular Weight (kD) |
N | Ka (106M−1) |
ΔH (kcal/mol) |
|---|---|---|---|---|
| Fondaparinux | 1.7 | 7.85 | 0.14 | −9.5 |
| LMH | ~5 | 11.8 | 0.40 | −20.7 |
| Heparin | ~15 | 3.86 | 1.48 | −56.3 |
These results suggest that the molecular weight of polysaccharides also play an important role in the binding of polysaccharides to NPs.
Interaction between NP–1 and Heparin Immobilized on the Surface by SPR
Cells present hundreds of thousands of polysaccharides on their surface. We expect that the interaction between synthetic polymer NPs and surface polysaccharides should differ significantly from those in homogeneous solution. To mimic the presentation of polysaccharides on a cell surface, heparin was immobilized on a SPR chip. Solutions of NP–1 were flowed over the SPR surface. Binding was recorded as a percentage shift in the SPR angle (Supporting Information Fig. 3). By fitting the association and dissociation curve, Kon of 7.45E+05M−1 sec−1 and Koff of 4.17E-02 sec−1 were obtained. The average Kd for NP-1 from the SPR data was calculated to be approximately 80 nM. This value is far lower than the value (>1 µ M) from ITC and can be attributed to the multivalent interaction of NPs with multiple copies of heparin on the SPR surface. Multivalent interactions are well known in nature.24 Avidity of antibodies can be increased a 100 fold by multivalent interactions. Lectins that recognize carbohydrates make use of collective weak interactions to capture carbohydrates with high affinity. The NPs used in this study are much larger than heparin. The large deformable surface can provide multivalent interactions. Several heparin macromolecules can bind to a single NP and therefore boost the apparent affinity (or avidity). Therefore, when it comes to polysaccharides on the surface of cells, it calls attention to capability of NPs for multivalent interaction and deviation of avidity from solution affinity.
Inhibition of a Heparin-Protein Interactions by Synthetic Polymer NPs
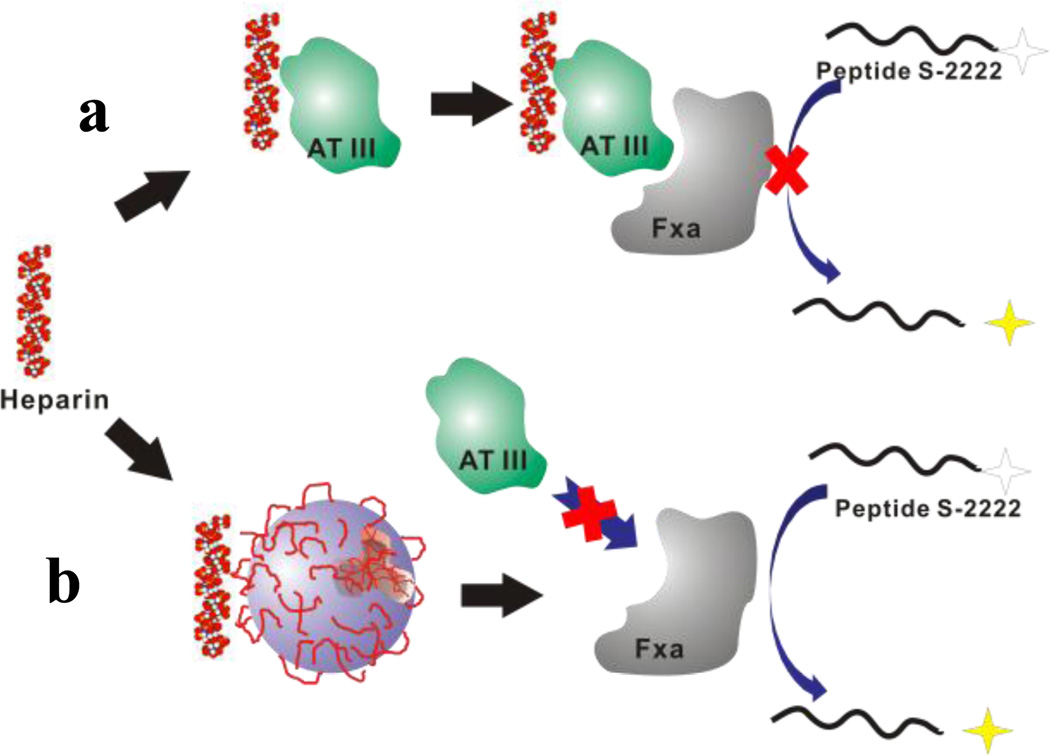
The potential applications of synthetic polymers and organic coated inorganic NPs in nanomedicine are substantial. In vitro or in vivo studies expose the NPs to a far more complicated milieu that is encountered in most controlled laboratory settings. To explore the influence of NPs on the polysaccharide-protein interaction in a somewhat more complicated system, we chose to use the anticoagulant activity of heparin as a test case.25 In this system, heparin binds to the protein AT-III to form a complex. Subsequent binding of FXa by the complex inhibits FXa’s activity (Fig. 9a). The residual FXa can be quantified colormetrically by reaction with the peptide S-2222 which liberates a dye. A subset of our library of AAm NPs containing a range of the ATC monomer (NP-3, 4 and 5) was chosen for the inhibition test as these NPs have both high affinities and high capacities for heparin in the library according to the ITC study. NPs were added to the polysaccharide protein mixture to study their ability to inhibit the heparin-AT binding. The analysis is predicated on the assumption that NP binding to heparin will prevent formation of the heparin-AT complex restoring the downstream activity of FXa to trigger the enzymatic cleavage of peptide S-2222 by free FXa to produce a UV signal (Fig. 9b).
Figure 9.
Anticoagulant assay: a) Heparin binds to the protein AT-III to form a complex. This complex can inhibit the activity of FXa by binding to FXa. The residual FXa can be quantified colormetrically by a reaction with the peptide S-2222 which liberates a dye. b) Addition of NPs will compete for heparin. AT III without heparin only slightly inhibits FXa activity resulting in a large UV signal.
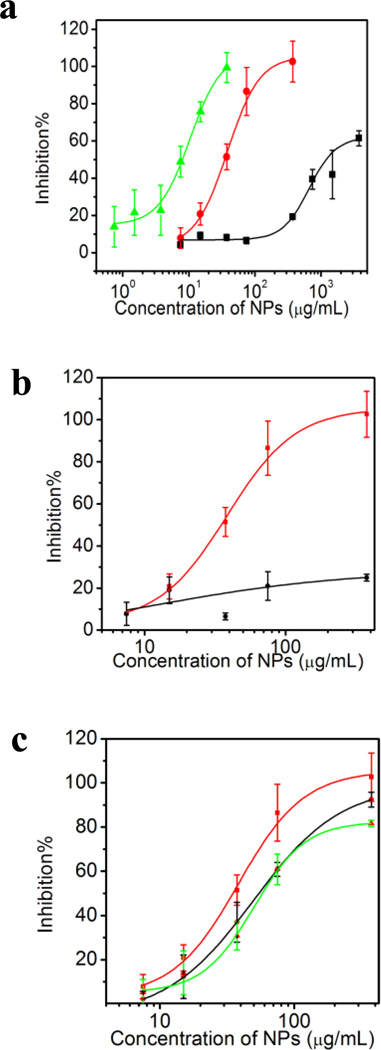
An initial screen of the AAm-based NPs revealed that they all increased the level of free FXa (Fig. 10a) but to a substantially different degree. Although NP-heparin binding is the most straightforward explanation, the results can also be explained by the NPs inhibition of the interaction between protein AT and protein FXa. Either scenario could restore the activity of FXa in the anticoagulant assay. To clarify this matter, a control experiment was carried out with low molecular weight heparin (~5 kD). Low molecular weight heparin has same anticoangulant activity as heparin (~15 kD).26 However, the affinity of LMHNP-4 is much lower (~3 µ M from ITC) than that of Heparin-NP-4 interaction (~500 nM from ITC). Within same concentration range, NP–4 only slightly restores the activity of FXa (Fig. 10b). This indicates that NPs are less likely to inhibit the interaction between protein AT and protein FXa. We propose that the observed results are due to NP inhibition of the heparin-protein AT interaction.
Figure 10.
a) Concentration-neutralization curves of NPs in the anticoagulant assay: NP–3(2%ATC) (black line), NP–4 (5% ATC) (red line) and NP–5 (10%ATC) (green line). b) Anticoagulant assay with low molecular weight heparin (black line) or heparin (red line): various concentrations of NP–4(5%ATC) were added to the assay and the optical change at 405 nm was measured. c) Influence of added plasma on the neutralization capacity of NP–4 (5%ATC). 0~20% plasma (Red line: 0% plasma; Black line: 5% plasma; Green line: 20% plasma) was added to the assay.
The inhibition curve is shifted to lower concentrations as the % ATC in the NP increases (NP–3 (2%ATC) < NP–4 (5%ATC) < NP–5(10% ATC). This trend agrees with the ITC experiments, in which both affinity and stoichiometry increases in the same order. The calculated affinities from ITC for NP–5 (10%ATC), NP–4 (5%ATC) and NP–3 (2%ATC) are 50nM, 500nM and 600nM. It’s surprising that NPs with relatively low affinity inhibit the 20 nM heparin-ATIII interaction. Possible explanations take into consideration the multiple binding sites on the NPs and their affinity distribution. There are 17, 8 and 4 binding domains on NP–5, NP–4 and NP–3. Taking the stoichiometry into account, the apparent Kds for NP–5, NP–4 and NP–3 are 3 nM, 60 nM and 100 nM. At these Kds, half the heparin will be captured by NPs so the affinity is close to that of ATIII. In addition, the affinity obtained from ITC is an average of all polymer NPs in the sample. The NPs have a distribution of sizes and affinities. Thus, as-synthesized NPs are best viewed as crude polyclonal materials. We have found that a small subpopulation of as-synthesized NPs can have more than 1000 times higher affinity for a particular substrate than the average affinity.27 The same scenario can be applied in this case. Although the average affinity of NP–3 and NP–4 is lower than ATIII, a subpopulation of high affinity NPs may be comparable to ATIII. It is possible that these NPs assume a disproportionate role in heparin neutralization.
We next tested if added plasma proteins would interfere with the inhibition capacity of the NPs. It was found that the heparin capacity of NP–4(5%ATC) is somewhat diminished (Fig. 10c) with the addition of plasma protein. In the presence of 20% plasma, 2X the amount of NPs are required to neutralize same amount of heparin. This is consistent with formation of a “protein corona”3 surrounding a NP when added to a biological milieu. Since our NPs are positively charged, plasma proteins compete for binding sites on the surface of the NP with heparin. This would result in reduced heparin capacity of NPs which in turn would require more NPs to capture the same amount of heparin than in the absence of plasma. Nevertheless, it is important to note that even in the presence of plasma, NPs inhibit the heparin-ATIII interaction.
Overall, these experiments suggest that nanoparticles can capture heparin in a complex biological system. We propose that added NPs sequester heparin from its protein partner ATIII and interrupt the cascade of biological events resulting eventually in an optical response. In this case, the anticoagulant activity of heparin is suppressed. As heparin (and polysaccharides in general) is involved in many important interactions with proteins including cell growth, inflammation process and virus entry, this study offers promise that administration of NPs that have been designed and optimized to bind to specific polysaccharides may be used to regulate their function.
CONCLUSION
In summary, the interaction between synthetic polymer NPs and heparin has been systematically studied by ITC, SPR and an anticoagulant diagnostic. Hydrogen bonding, ionic interactions and dehydration all play important roles in the NP-polysaccharride interaction. The incorporation of different sources of positively charged monomers into the NPs can result in a change in the binding thermodynamics without significantly changing the overall affinity. Both high charge density and high crosslinking of the NPs contribute to high affinity. It has been demonstrated that there is significant difference in association thermodynamics between acrylamide-based NPs and NIPAm-based NPs. These differences can result in significantly different responses to varying binding conditions such as ionic strength and temperature. These studies provide a guideline to engineer synthetic polymer nanoparticles for biomedical applications. Since the synthetic polymer NPs are larger than the biomacromolecules they are capable of multivant interactions. It was demonstrated that interactions between surface immobilized heparin and NPs (SPR) are significantly stronger than those from homogeneous measurements. The greater affinity of NPs to surface presentations of heparin is attributed to avidity. It has also been established that NPs can inhibit the interaction between heparin and a protein even in the presence of plasma proteins. Given the fact that heparin (or polysaccharides in general)-protein interactions are key events in many biological process, these result call attention for unintended side effects of a NP delivery carrier. On the other hand knowledge of these interactions opens the door for possible applications of NPs as polymer drugs to inhibit polysaccharide-protein interactions (e.g. anticoagulant activity and virus entry). We believe this study contributes to understanding the behavior of synthetic polymer nanoparticles in biological systems and will aid in the design and composition of nanoparticles for specific therapeutic applications
Supplementary Material
ACKNOWLEDGMENT
We thank the NIH for funding and Prof. Steve White (Department of Biopysics, UCI) for providing access to ITC.
Funding Sources
NIH
ABBREVIATIONS
- NP
nanoparticle
- AAm
acrylamide
- BIS
ethylene-bis-acrylamide
- AAc
acrylic acid
- APM
aminopropylmethacrylamide
- AEM
aminoethylacrylamide
- ATC
(3-acrylamidopropyl) trimethyl ammonium chloride
- IM
1-vinyl imidazole
- NIPAm
isopropylacrylamide
- ITC
isothermal titration calorimetry
- SPR
surface, plasmon resonance
- LMH
low molecular weight heparin
- ATIII
Antithrombin III
- FXa
factor Xa
- GAG
glycosaminoglycans
Footnotes
ASSOCIATED CONTENT
Supporting Information
Supporting Information Available: Experimental methods for NPs preparation, ITC measurements, SPR measurements, anticoagulant assay, affinities of heparin-NPs under different pH and heat capacity change for NP-6(2%APM) at acidic pH. This material is available free of charge via the Internet at http://pubs.acs.org.
REFERENCES
- 1.(a) Lynch I, Dawson KA, Linse S. Sci. STKE. 2006;327:14. doi: 10.1126/stke.3272006pe14. [DOI] [PubMed] [Google Scholar]; (b) Nel AE, Madler L, Velegol D, Xia T, Hoek EMV, Somasundaran P, Klaessig F, Castranova V, Thompson M. Nat. Mater. 2009;8:543. doi: 10.1038/nmat2442. [DOI] [PubMed] [Google Scholar]; (c) Walczyk D, Bombelli FB, Monopoli MP, Lynch I, Dawson KA. J. Am. Chem. Soc. 2010;132:5761. doi: 10.1021/ja910675v. [DOI] [PubMed] [Google Scholar]
- 2.(a) Rocker C, Potzl M, Zhang F, Parak WJ, Nienhaus GU. Nat. Nanotechnol. 2009;4:577. doi: 10.1038/nnano.2009.195. [DOI] [PubMed] [Google Scholar]; (b) Mahmoudi M, Lynch I, Ejtehadi MR, Monopoli MP, Bombelli FB, Laurent S. Chem. Rev. 2011;111:5610. doi: 10.1021/cr100440g. [DOI] [PubMed] [Google Scholar]; (c) Saha K, Bajaj A, Duncan B, Rotello VM. Small. 2011;7:1903. doi: 10.1002/smll.201100478. [DOI] [PMC free article] [PubMed] [Google Scholar]
- 3.(a) Cedervall T, Lynch I, Lindman S, Berggard T, Thulin E, Nilsson H, Dawson KA, Linse S. Proc. Natl. Acad. Sci. U.S.A. 2007;104:2050. doi: 10.1073/pnas.0608582104. [DOI] [PMC free article] [PubMed] [Google Scholar]; (b) Cedervall T, Lynch I, Foy M, Berggard T, Donnelly SC, Cagney G, Linse S, Dawson KA. Angew. Chem. Int. Ed. 2007;46:5754. doi: 10.1002/anie.200700465. [DOI] [PubMed] [Google Scholar]
- 4.Sasisekharan R, Shriver Z, Venkataraman G, Narayanasami U. Nat. Rev. 2002;2:521. doi: 10.1038/nrc842. [DOI] [PubMed] [Google Scholar]
- 5.(a) Imberty A, Lortat-Jacob H, Perez S. Carbohyd. Res. 2007;342:430. doi: 10.1016/j.carres.2006.12.019. [DOI] [PubMed] [Google Scholar]; (b) Gandhi NS, Mancera RL. Chem Biol. Drug. Des. 2008;72:455. doi: 10.1111/j.1747-0285.2008.00741.x. [DOI] [PubMed] [Google Scholar]
- 6.(a) Capila I, Linhardt RJ. Angew. Chem. Int. Ed. 2002;41:390. doi: 10.1002/1521-3773(20020201)41:3<390::aid-anie390>3.0.co;2-b. [DOI] [PubMed] [Google Scholar]; (b) Raman R, Sasisekharan V, Sasisekharan R. Chem. & Bio. 2005;12:267. doi: 10.1016/j.chembiol.2004.11.020. [DOI] [PubMed] [Google Scholar]
- 7.(a) Otsuka H, Akiyama Y, Nagasaki Y, Kataoka K. J. Am. Chem. Soc. 2001;123:8226. doi: 10.1021/ja010437m. [DOI] [PubMed] [Google Scholar]; (b) Wilson R, Chen Y, Aveyard J. Chem. Commun. 2004:1156. doi: 10.1039/b402786h. [DOI] [PubMed] [Google Scholar]; (c) Osaki F, Kanamori T, Sando S, Sera T, Aoyama Y. J. Am. Chem. Soc. 2004;126:6520. doi: 10.1021/ja048792a. [DOI] [PubMed] [Google Scholar]; (d) Babu P, Sinha S, Surolia A. Bioconjugate Chem. 2007;18:146. doi: 10.1021/bc060204q. [DOI] [PubMed] [Google Scholar]; (e) Ma K, Kim S, Park K, Kim K, Woo DG, Kwon IC, Chuang H-M, Park K-H. J. Am. Chem. Soc. 2007;129:5788. doi: 10.1021/ja067707r. [DOI] [PubMed] [Google Scholar]; (f) Earhart C, Jana NR, Erathodiyil N, Ying JY. Langmuir. 2008;24:6215. doi: 10.1021/la800066g. [DOI] [PubMed] [Google Scholar]; (g) Kemp MM, Linhardt RJ. Wiley Interdisciplinary Reviews: Nanomedicine and Nanobiotechnology. 2010;2:77. doi: 10.1002/wnan.68. [DOI] [PubMed] [Google Scholar]; (h) Lee DY, Khatun Z, Lee J-H, Lee Y-K, In I. Biomacromolecules. 2011;12:336. doi: 10.1021/bm101031a. [DOI] [PubMed] [Google Scholar]
- 8.(a) Haag R, Kratz F. Angew. Chem. Int. Ed. 2006;45:1198. doi: 10.1002/anie.200502113. [DOI] [PubMed] [Google Scholar]; (b) Cabaleiro- Lago C, Quinlan-Pluck F, Lynch I, Lindman S, Minogue AM, Thulin E, Walsh DM, Dawson KA, Linse S. J. Am. Chem. Soc. 2008;130:15437. doi: 10.1021/ja8041806. [DOI] [PubMed] [Google Scholar]; (c) Davis ME, Chen Z, Shin DM. Nat. Rev. Drug Deliv. 2008;7:771. doi: 10.1038/nrd2614. [DOI] [PubMed] [Google Scholar]; (d) De M, Ghosh PS, Rotello VM. Adv. Mater. 2008;20:4225. [Google Scholar]; (e) Rana S, Yeh Y-C, Rotello VM. Curr. Opin. Chem. Biol. 2010;14:828. doi: 10.1016/j.cbpa.2010.10.001. [DOI] [PMC free article] [PubMed] [Google Scholar]; (h) Hoshino Y, Shea KJ. J. Mater. Chem. 2011;20:3517. [Google Scholar]
- 9.(a) Shieh MT, WuDunn D, Montgomery RI, Esko JD, Spear PG. J. Cell Biol. 1992;116:1273. doi: 10.1083/jcb.116.5.1273. [DOI] [PMC free article] [PubMed] [Google Scholar]; (b) Shukla D, Liu J, Blaiklock P, Shworak NW, Bai X, Esko JD, Cohen GH, Eisenberg RJ, Rosenberg RD, Spear PG. Cell. 1999;99:13. doi: 10.1016/s0092-8674(00)80058-6. [DOI] [PubMed] [Google Scholar]; (c) Tyagi M, Rusnati M, Presta M, Giacca M. J. Biol. Chem. 2001;276:3254. doi: 10.1074/jbc.M006701200. [DOI] [PubMed] [Google Scholar]; (d) Sandgren S, Cheng F, Belting M. J. Biol. Chem. 2002;277:38877. doi: 10.1074/jbc.M205395200. [DOI] [PubMed] [Google Scholar]; (e) Belting M. Trends Biochem. Sci. 2003;28:145. doi: 10.1016/S0968-0004(03)00031-8. [DOI] [PubMed] [Google Scholar]; (f) Ziegler A, Seelig J. Biochemistry. 2011;50:4650. doi: 10.1021/bi1019429. [DOI] [PubMed] [Google Scholar]
- 10.(a) Mislick KA, Baldeschwieler JD. Proc. Natl. Acad. Sci. U. S. A. 1996;93:12349. doi: 10.1073/pnas.93.22.12349. [DOI] [PMC free article] [PubMed] [Google Scholar]; (b) Wiethoff CM, Smith JG, Koe GS, Middaugh R. J. Biol. Chem. 2001;276:32806. doi: 10.1074/jbc.M007940200. [DOI] [PubMed] [Google Scholar]; c) Ruponen M, Honkakoski P, Tammi M, Urtti A. J. Gene Med. 2004;6:405. doi: 10.1002/jgm.522. [DOI] [PubMed] [Google Scholar]
- 11.(a) Clark HA, Kopelman R, Tjalkens R, Philbert MA. Anal. Chem. 1999;71:4837. doi: 10.1021/ac990630n. [DOI] [PubMed] [Google Scholar]; (b) McAllister K, Peter S, Adam M, Cho MJ, Rubinstein M, Samulski RJ, DeSimone JM. J. Am. Chem. Soc. 2002;124:15198. doi: 10.1021/ja027759q. [DOI] [PubMed] [Google Scholar]; (c) Murthy N, Xu M, Schuck S, Kunisawa J, Shastri N, Frechet JMJ. Proc. Natl. Acad. Sci. U. S. A. 2003;100:4995. doi: 10.1073/pnas.0930644100. [DOI] [PMC free article] [PubMed] [Google Scholar]; (d) Sun H, Scharff-Poulsen AM, Gu H, Jakobsen I, Kossman JM, Frommer WB, Almadal K. ACS nano. 2008;2:19. doi: 10.1021/nn700166x. [DOI] [PubMed] [Google Scholar]; (e) Hoshino Y, Kodama T, Okahata Y, Shea KJ. J. Am. Chem. Soc. 2008;130:15242. doi: 10.1021/ja8062875. [DOI] [PubMed] [Google Scholar]; (f) Lee Y-EK, Kopelman R, Smith R. Annu. Rev. Anal. Chem. 2009;1:57. doi: 10.1146/annurev.anchem.1.031207.112823. [DOI] [PMC free article] [PubMed] [Google Scholar]; (g) Zeng Z, Hoshino Y, Rodriguez A, Yoo H, Shea KJ. ACS Nano. 2010;4:199. doi: 10.1021/nn901256s. [DOI] [PMC free article] [PubMed] [Google Scholar]; (h) Hoshino Y, Koide H, Urakami T, Kanazawa H, Kodama T, Oku N, Shea KJ. J. Am. Chem. Soc. 2010;132:6644. doi: 10.1021/ja102148f. [DOI] [PMC free article] [PubMed] [Google Scholar]
- 12.(a) Candau F, Leong YS, Pouyet G, Candau S. J. Colloid Interface Sci. 1984;101:167. [Google Scholar]; (b) Antonietti M. Angew. Chem. Int. Ed. 1988;27:1743. [Google Scholar]
- 13.(a) Dam TK, Brewer CF. Chem. Rev. 2002;102:387. doi: 10.1021/cr000401x. [DOI] [PubMed] [Google Scholar]; (b) Lindman S, Lynch I, Thulin E, Nilsson H, Dawson KA, Linse S. Nano Lett. 2007;7:914. doi: 10.1021/nl062743+. [DOI] [PubMed] [Google Scholar]; (c) Ball V, Maechling C. Int. J. Mol. Sci. 2009;10:3283. doi: 10.3390/ijms10083283. [DOI] [PMC free article] [PubMed] [Google Scholar]; (d) Henzler K, Haupt B, Lauterbach K, Wittemann A, Borisov O, Ballauff M. J. Am. Chem. Soc. 2010;132:3159. doi: 10.1021/ja909938c. [DOI] [PubMed] [Google Scholar]
- 14.(a) Israelachvili JN. Intermolecular and Surface Forces. 2nd ed. London: Academic Press; 1992. [Google Scholar]; (b) De M, You C-C, Srivastava S, Rotello VM. J. Am. Chem. Soc. 2007;129:10747. doi: 10.1021/ja071642q. [DOI] [PubMed] [Google Scholar]
- 15.(a) Record MT, Jr, Lohman TM, deHaseth P. J. Mol. Biol. 1976;107:145. doi: 10.1016/s0022-2836(76)80023-x. [DOI] [PubMed] [Google Scholar]; (b) Manning GSQ. Rev. Biophys. 1978;11:179. doi: 10.1017/s0033583500002031. [DOI] [PubMed] [Google Scholar]
- 16.(a) Thompson LD, Pantoliano MW, Springer BA. Biochemistry. 1994;33:3831. doi: 10.1021/bi00179a006. [DOI] [PubMed] [Google Scholar]; (b) Ahl I-M, Jonsson B-H, Tibell LA. Biochemistry. 2009;48:9932. doi: 10.1021/bi900981k. [DOI] [PubMed] [Google Scholar]; (c) Sun J, Yu J-S, Jin S, Zha X, Wu Y, Yu Z. Biochemistry. 2009;48:9932. [Google Scholar]
- 17.(a) Tanaka T. Sci. Am. 1981;244:124. doi: 10.1038/scientificamerican0181-124. [DOI] [PubMed] [Google Scholar]; (b) Hocking MB, Klimchuk KA, Lowen SJ. Polym. Sci. Part A: Polym Chem. 2000;38:3128. [Google Scholar]
- 18.(a) Dam TK, Roy R, Page D, Brewer CF. Biochemistry. 2002;41:1351. doi: 10.1021/bi015830j. [DOI] [PubMed] [Google Scholar]; (b) Alvarado D, Klein DE, Lemmon MA. Cell. 2010;142:568. doi: 10.1016/j.cell.2010.07.015. [DOI] [PMC free article] [PubMed] [Google Scholar]
- 19.(a) Sharp KA, Madan B. J. Phy. Chem. B. 1997;101:4343. [Google Scholar]; (b) Stites WE. Chem. Rev. 1997;97:1233. doi: 10.1021/cr960387h. [DOI] [PubMed] [Google Scholar]; (c) Jennings RN, Linhardt R. J. Biochemistry. 1998;37:15231. doi: 10.1021/bi980212x. [DOI] [PubMed] [Google Scholar]; (d) Prabhu NV, Sharp KA. Annu. Rev. Phys. Chem. 2005;56:521. doi: 10.1146/annurev.physchem.56.092503.141202. [DOI] [PubMed] [Google Scholar]
- 20.(a) van de Wetering P, Zuidam NJ, van Steenbergen MJ, van der Houwen OAGJ, Underberg WJM, Hennink WE. Macromolecules. 1998;31:8063. [Google Scholar]; (b) Hu X, Tong Z, Lyon LA. Colloid Polym. Sci. 2010;289:333. doi: 10.1007/s00396-010-2347-y. [DOI] [PMC free article] [PubMed] [Google Scholar]
- 21.(a) Kozlov AG, Lohman TM. Proteins. 2000;4:8. doi: 10.1002/1097-0134(2000)41:4+<8::aid-prot20>3.0.co;2-h. [DOI] [PubMed] [Google Scholar]; (b) Nguyen B, Stanek J, Wilson WD. Biophys. J. 2006;90:1319–1328. doi: 10.1529/biophysj.105.071381. [DOI] [PMC free article] [PubMed] [Google Scholar]
- 22.Liu L, Guo QX. Chem. Rev. 2001;101:673. doi: 10.1021/cr990416z. [DOI] [PubMed] [Google Scholar]
- 23.(a) Uhrich KE, Cannizzaro SM, Langer RS, Shakesheff KM. Chem. Rev. 1999;99:3181. doi: 10.1021/cr940351u. [DOI] [PubMed] [Google Scholar]; (b) Mintzer MA, Simanek EE. Chem. Rev. 2009;109:259. doi: 10.1021/cr800409e. [DOI] [PubMed] [Google Scholar]; (c) de las Heras Alarcon C, Pennadam S, Alexander C. Chem. Soc. Rev. 2005;34:276–285. doi: 10.1039/b406727d. [DOI] [PubMed] [Google Scholar]; (d) Guan Y, Zhang Y. Soft. Mater. 2011;7:6375. [Google Scholar]
- 24.(a) Mammen M, Choi S-K, Whitesides GM. Angew. Chem. Int. Ed. 1998;37:2754. doi: 10.1002/(SICI)1521-3773(19981102)37:20<2754::AID-ANIE2754>3.0.CO;2-3. [DOI] [PubMed] [Google Scholar]; (b) Mann DA, Kanai M, Maly DJ, Kiessling LL. J. Am. Chem. Soc. 1998;120:41. [Google Scholar]; (c) Badjic JD, Nelson A, Cantrill SJ, Turnbull WB, Stoddart JF. Acc. Chem. Res. 2005;38:723. doi: 10.1021/ar040223k. [DOI] [PubMed] [Google Scholar]; (d) Munoz EM, Correa J, Fernandez-Megia E, Riguera R. J. Am. Chem. Soc. 2009;131:17765. doi: 10.1021/ja9074826. [DOI] [PubMed] [Google Scholar]; (e) Cuesta AM, Sanchez-Martin D, Sanz L, Bonet J, Compte M, Kremer L, Blanco FJ, Oliva B, Alvarez-Vallina L. PLoS One. 2009;4:5381. doi: 10.1371/journal.pone.0005381. [DOI] [PMC free article] [PubMed] [Google Scholar]; (f) Cuesta AM, Sainz-Pastor N, Bonet J, Oliva B, Vallina LA. Trends Biotech. 2010;28:355. doi: 10.1016/j.tibtech.2010.03.007. [DOI] [PubMed] [Google Scholar]
- 25.Liu S, Zhou F, Hook M, Carson DD. Proc. Natl. Acad. Sci. U. S. A. 1997;94:1739. doi: 10.1073/pnas.94.5.1739. [DOI] [PMC free article] [PubMed] [Google Scholar]
- 26.(a) Murphy SA, Gibson CM, Morrow DA, Van de Werf F, Menown IB, Goodman SG, Mahaffey KW, Cohen M, McCabe CH, Antman EM, Braunwald E. Eur. Heart J. 2007;28:2077. doi: 10.1093/eurheartj/ehm224. [DOI] [PubMed] [Google Scholar]; (b) Gray E, Mulloy B, Barrowcliffe TW. Thromb. Haemost. 2008;99:807. doi: 10.1160/TH08-01-0032. [DOI] [PubMed] [Google Scholar]
- 27.Hoshino Y, Haberaecker WW, III, Kodama T, Zeng Z, Okahata Y, Shea KJ. J. Am. Chem. Soc. 2010;132:13648. doi: 10.1021/ja1058982. [DOI] [PMC free article] [PubMed] [Google Scholar]
Associated Data
This section collects any data citations, data availability statements, or supplementary materials included in this article.


