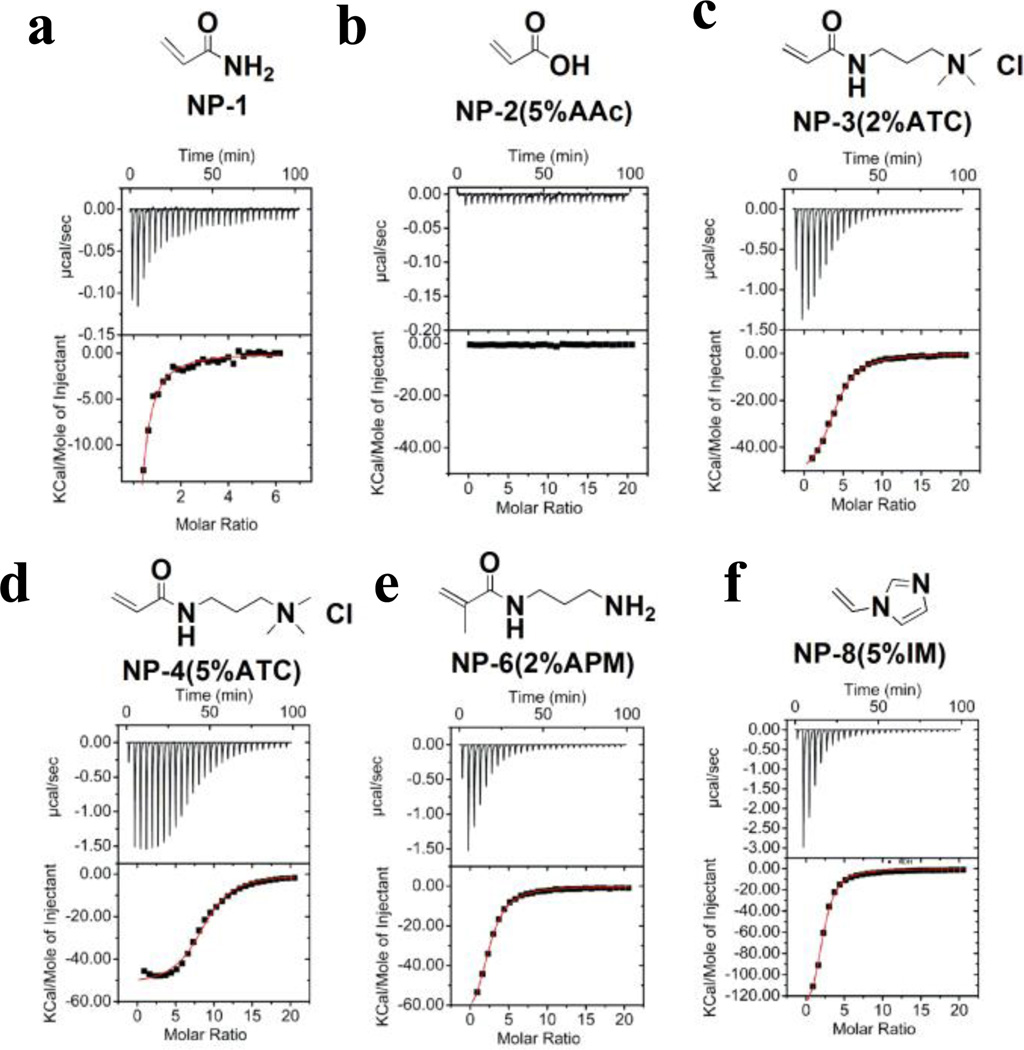
Figure 2.
ITC Study of Heparin-NP Interaction. Heparin (0.1 mM) in 10 mM PBS was titrated into 1mg/mL of a) NP–1 (10% BIS, 90% AAm); b) NP–2 (5% AAc); c) NP–3 (2% ATC); d) NP–4 (5%ATC); e) NP–6 (2% APM);f) NP–8 (5% IM). For each titration, the upper graph shows the titration curve. In most cases, heat is generated upon injection of the ligand into the cell. The titration curve was integrated in the lower graph and fitted by a single-site model.

