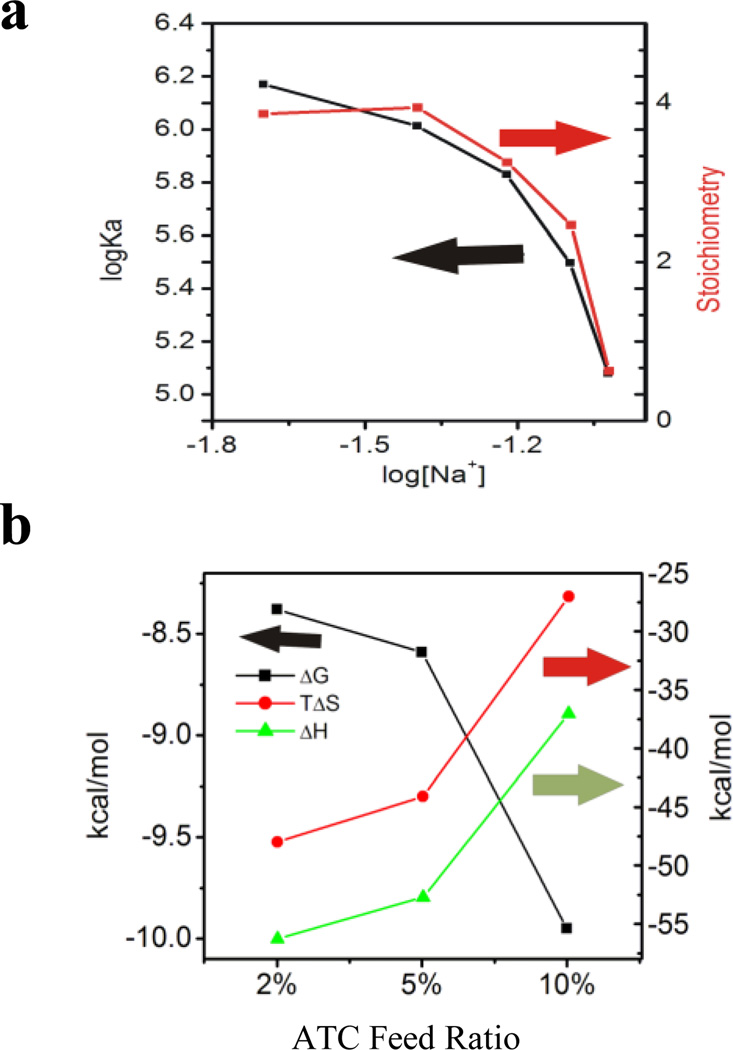
Figure 3.
a) The titration of heparin into NP–3(2%ATC) at various salt concentrations: 20 mM, 40 mM, 60 mM, 75mM NaCl. Log Ka (black line) and stoichiometry (N) (red line) from the titrations are plotted against log [Na+]. b) Enthalpy (green line), entropy (red line) and free energy (black line) plot for the interaction of NP–3(2%ATC), NP–4 (5%ATC) and NP–5 (10%ATC) against heparin in 10 mM PBS.

