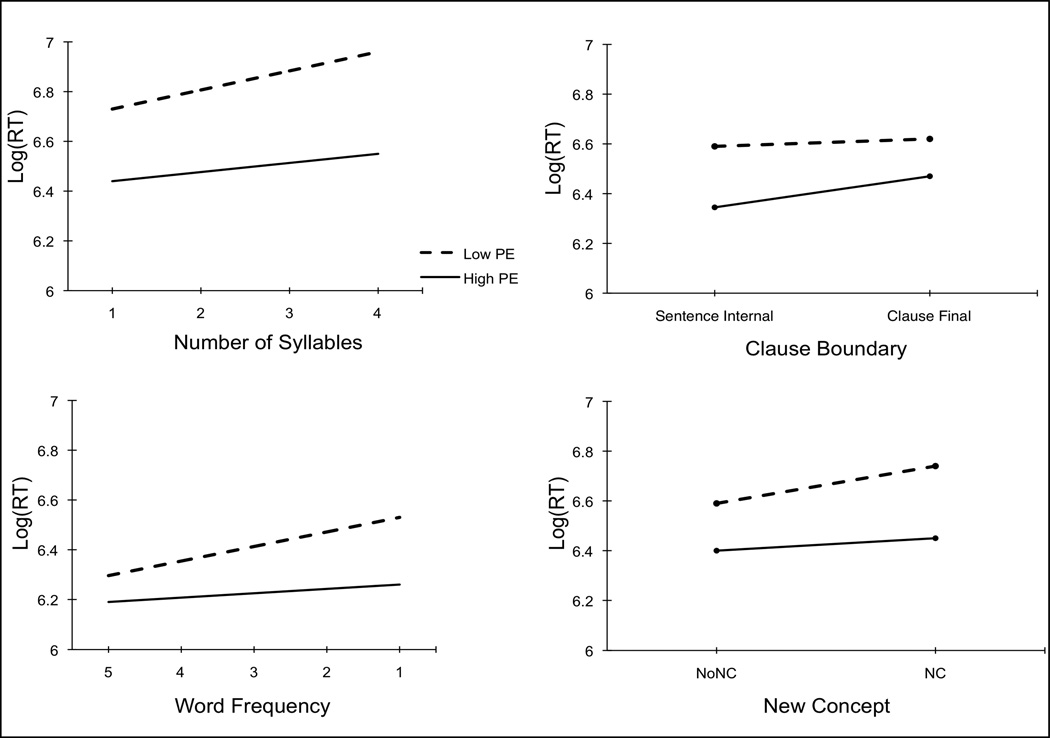
Figure 1.
Partial Effects Plots of Significant Interactions in Model 2 at Conditional Levels of Print Exposure (Low Print Exposure = 1 SD Below the Mean; High Print Exposure = 1 SD Above the Mean). Note: PE = Print Exposure; NC = New Concept; Word Frequency is plotted in reverse to show effect from high frequency to low frequency.

