
Figure 5.
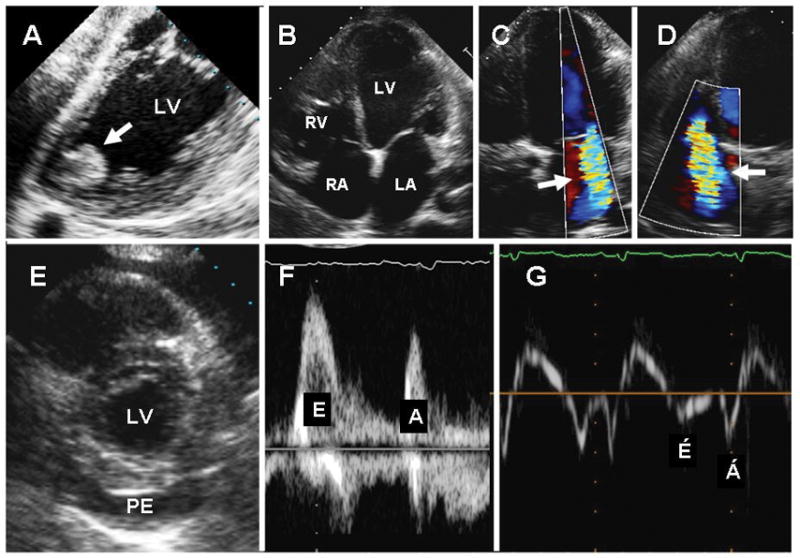
Echocardiographic findings in Chagas heart disease. A. Transesophageal echocardiography demonstrating an apical aneurysm containing a large, round, and protruding thrombus (arrow); B–D. Transthoracic apical 4-chamber views of the heart showing dilated cardiac chambers (B), and functional mitral (C) and tricuspid (D) regurgitation (arrows). E. Parasternal short-axis view of the heart showing a large pericardial effusion (PE). F–G. Trans-mitral pulsed-Doppler (F) and lateral annulus tissue Doppler (G) demonstrating apparently normal peak early (E) and late (A) transmitral velocities, E/A ratio, and E-wave deceleration time (F) but abnormal early (E′) and late (A′) velocities (G) consistent with advanced diastolic dysfunction. LA=left atrium; LV=left ventricle; PE=pericardial effusion; RA=right atrium; RV=right ventricle. From Tanowitz HB, Machado FS, Jelicks LA, et al: Perspectives on Trypanosoma cruzi-induced heart disease (Chagas disease). Prog Cardiovasc Dis 2009; 51: 524-39, with permission.