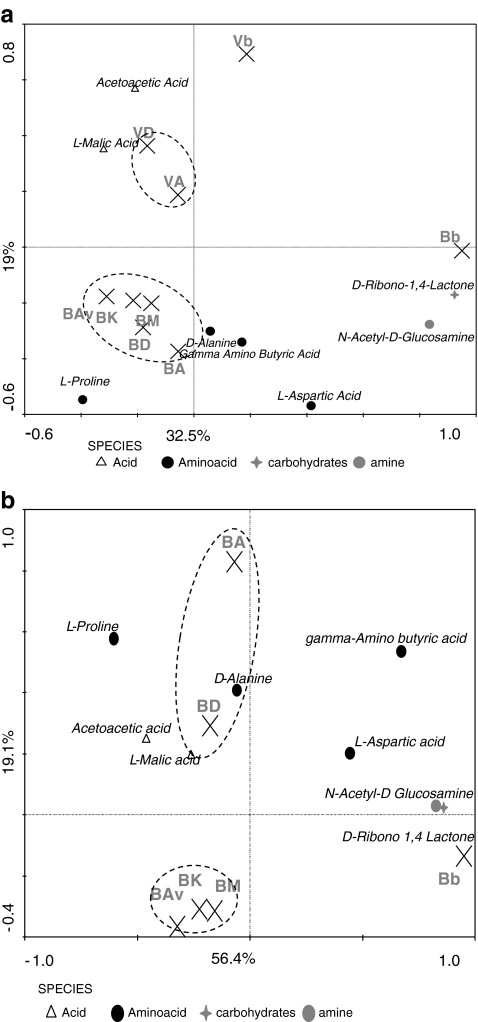
Figure 2.
Ordination biplots generated by redundancy analysis (RDA) of consumption of carbon sources for a soil B and V and b soil B (B Buinen, V Valthermond, A Aveka, Av Aventra, K Karnico, M Modena, D Désierée, b bulk). The eigenvalues displayed on the diagram axes refer to the percentage variation of carbon consumption; environment correlation accounted for at the respective axis. Compounds shown on the diagrams are analyzed by PCR-DGGE

