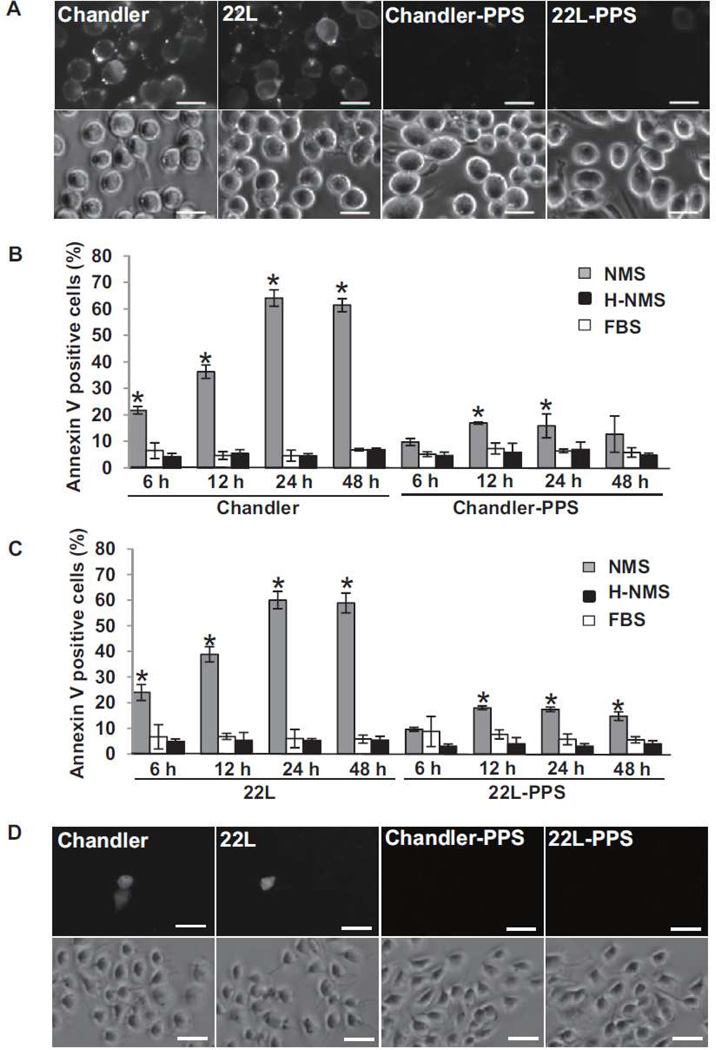
Fig. 1.
Effects of treatment of scrapie-infected N2a cells with NMS. (A) Annexin V staining on N2a cells treated with NMS. Chandler-infected, 22L-infected or PPS-cured (from Chandler or 22L infection, respectively) N2a cells were seeded in 24 well plates and cultured for 2 days. The cells were treated with 10% NMS for 24 h and stained with Annexin V. Bars show 20 µm. (B) Time course of the percentage of Annexin V positive cells in Chandler-infected and PPS-cured N2a cells. The cells were treated with NMS, H-NMS or FBS for 6, 12, 24 and 48 h and stained with Annexin V. The graphs show the means of the proportion of Annexin V positive cells in three fields. The error bars show standard deviation (SD). Gray bars, NMS treated cells. White bars, HS treated cells. Black bars, FBS treated cells. *p<0.01 vs H-NMS or FBS-treated cells (Student’s t test). The results are representative of 3 independent experiments. (C) Time course of the percentage of Annexin V positive cells in 22L-infected and PPS-cured N2a cells. The graphs show the mean of the proportion of Annexin V positive cells in three fields. The error bars show SD. Gray bars, NMS treated cells. White bars, H-NMS treated cells. Black bars, FBS treated cells. *p<0.01 vs HS or FBS-treated cells (Student’s t test). The results are representative of 3 independent experiments. (D) PI uptake into N2a cells treated with NMS. Chandler-infected, 22L-infected or PPS-cured (from Chandler or 22L infection, respectively) N2a cells were seeded in 24 well plates and cultured for 2 days. The cells were treated with 10% NMS for 24 h and stained with PI. Bars show 50 µm.

