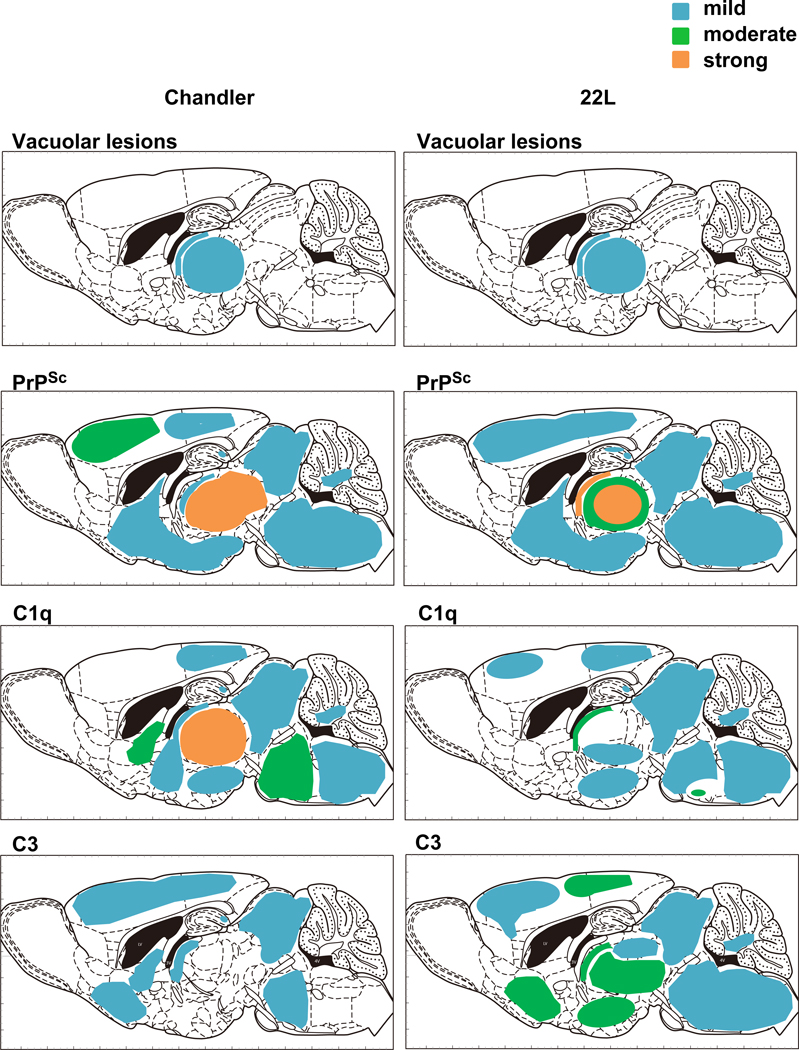
Fig. 5.
Summary of distribution of vacuolation, PrPSc, C1q and C3 of Chandler- or 22L-infected mouse at 90 dpi. The colors indicate the severity of vacuolation or relative intensity of PrPSc, C1q or C3 deposition. Blue, mild; Green, moderate; Orange, strong; Graphics of the sagittal section of mouse brain are from “The Mouse Brain 2nd edition” (Academic Press).

