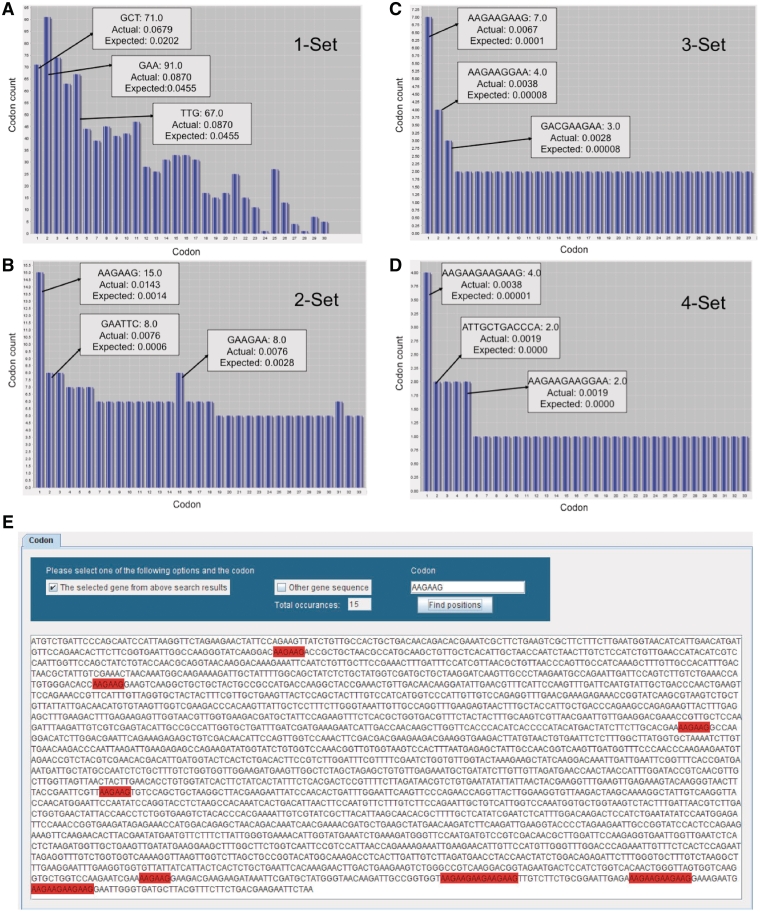
Figure 2.
GSCC visual output demonstrating codon combinations in YEF3. Bar graphs (A–D) of single, double, triple, and quadruple codon combinations in the YEF3 gene, respectively. Each bar represents a codon. When the user places the mouse pointer over the each bar (codon) in GSCC, it shows the quantitated values of the codon. In all the graphs, the bars are sorted in the descending order of (actual–expected frequency). Codon painting (E) takes user input information, consisting of individual codons or codon runs, and highlights these occurrences in the gene sequence.

