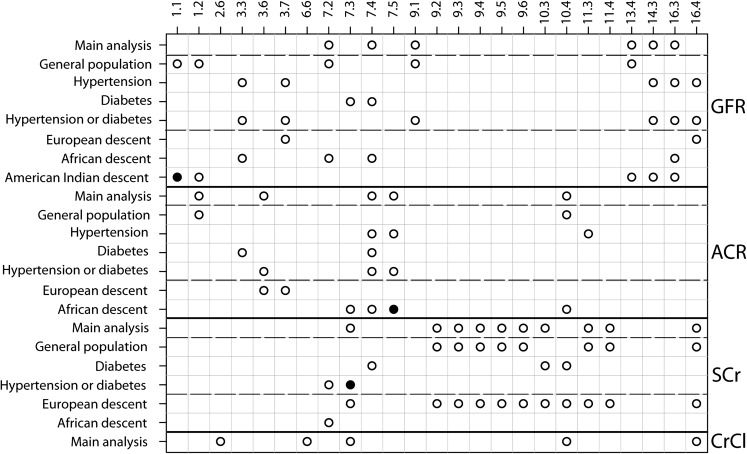
Fig. 5.
Summary of inferences in main and subgroup analyses across all phenotypes. Shown are all main and subgroup analyses (vertical axis) and the bins that reached at least suggestive significance in any main analysis, genome-wide significance in any analysis or suggestive significance in at least three of the subgroup analyses across all phenotypes (horizontal axis). Bins that reached suggestive significance only in one or two subgroup analyses are not shown. Cells with open circles: suggestive significance (P-value ≤ 0.05); cells with filled circles: genome-wide significance (P-value ≤ 0.00042).

