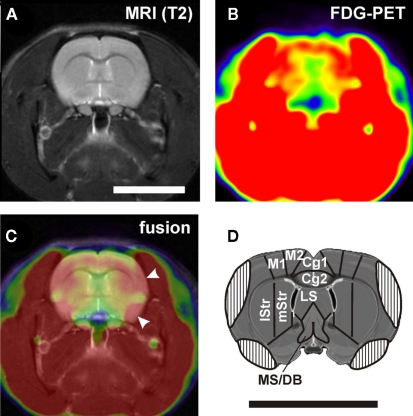
Figure 2.
(A) Example of a structural MRI and (B) the corresponding PET image. (C) Fusion of the two images shows muscle artifacts on the lateral aspects of the brain (arrowheads). This leads to covering of the lateral cortical regions in the atlas (D). Cg1, Cg2, anterior cingulate cortex area 1 and 2; LS, lateral septum; lStr, dorsolateral striatum; M1, motor cortex; M2, premotor cortex; MS/DB, medial septum and diagonal band of Broca; mStr, mediodorsal striatum. Scale bars: 1 cm.

