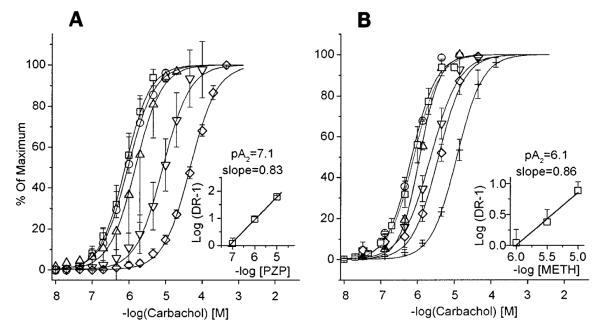
Fig. 1.
Carbachol dose-response displace-ment curves and Schild plots (insets) for pirenzepine (PZP, A) and methoctramine (Meth, B) effect on rat bladder strips in vitro. Data are expressed as percent of each individual strip’s maximal carbachol response. PZP: control (□), n = 16, maximum (max) = 4.8 ± 0.4 g; 10 nM (○), n = 4, max = 4.5 ± 1.4 g; 100 nM (△), n = 7, max = 4.2 ± 0.8 g; 1 μM (▽), n = 8, max = 4.0 ± 0.9 g; 10 μM (◇), n = 4, max = 4.3 ± 0.6 g. Meth: control (□), n = 16, max = 4.2 ± 0.8 g; 10 nM (○), n = 14, max = 4.3 ± 0.5 g; 100 nM (△), n = 6, max = 3.8 ± 0.4 g; 1 μM (▽) n = 5, max = 4.1 ± 1.0 g; 3 μM (◇), n = 3, max = 4.8 ± 1.2 g; 10 μM (+), n = 5, max = 3.0 ± 0.3 g. Slopes of Schild plots for both PZP and Meth are not significantly different from 1.0.

