
FIGURE 3.
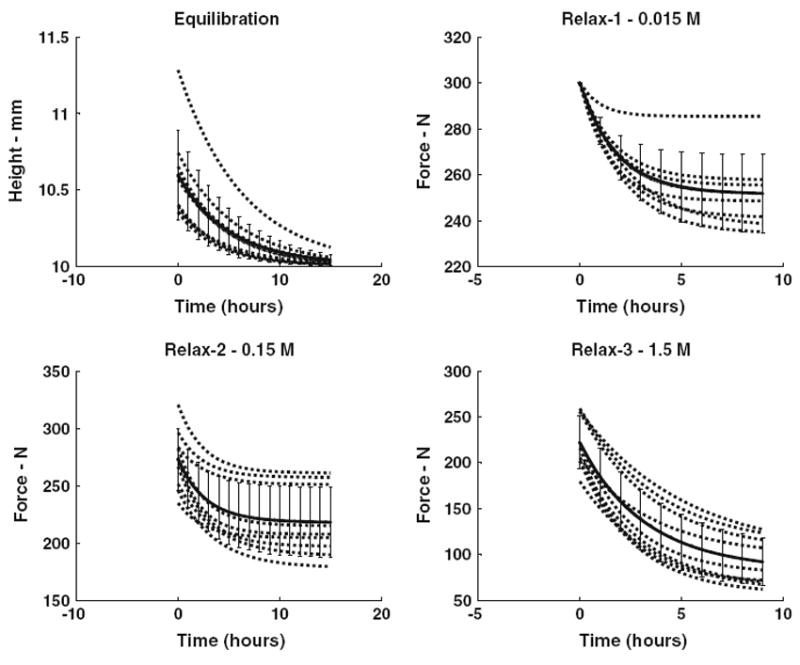
Exponential curve fits to experimental recordings of specimen height (initial equilibration) and of compressive force (three force–relaxation experiments at different bath concentrations). In each panel the lines are curve fits for individual specimens together with a mean curve-fit (error bars are SEM).