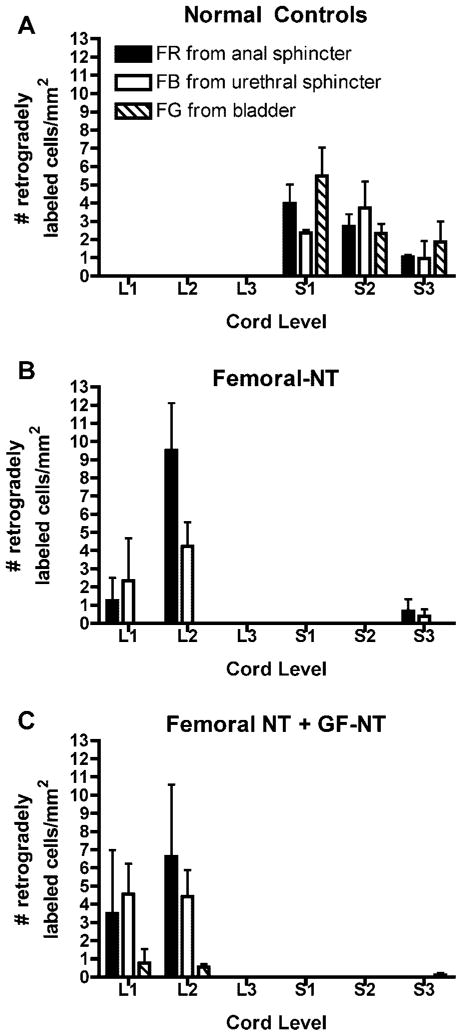
Fig. 7.
Graphs showing number of retrogradely labeled cells per mm2 in lumbar (L1, L2, L3) and sacral (S1, S2, S3) spinal cord segments in (A) a normal control, (B) the animals in which femoral motor nerve branches were transferred to the pudendal nerve (femoral-NT), and (C) the animal in which both femoral NT and genitofemoral-pelvic nerve transfer (GF-NT) was performed.

