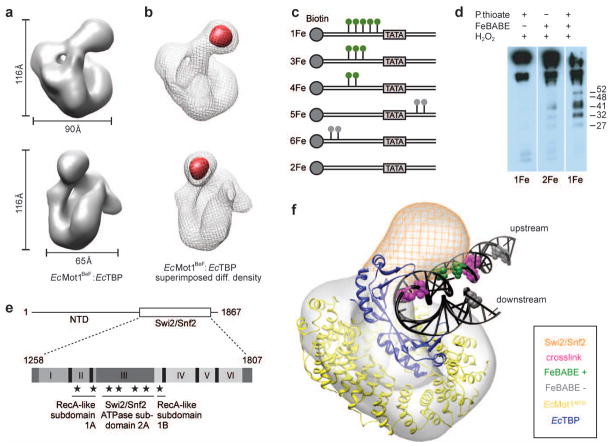
Figure 3. 3D reconstruction of the EcMot1:EcTBP complex and model of the EcMot1:EcTBP:DNA complex.
a, Two views of the EcMot1BeF:EcTBP density. ADP-BeF3− was added due to assumed stabilization of the ATPase domain b, Subtraction map (red) between EcMot1BeF:EcTBP (grey mesh) and EcMot1 ΔCT:EcTBP density maps. c, DNA probes with phosphorothioates (green/grey lollipops) used in FeBABE cleavage assays. d, FeBABE-mediated cleavage of Mot1 analyzed by Western blot30 with approximate sizes of the cleavage products in kDa. e, Summary of FeBABE results. Stars represent approximate sites of cleavage mediated by FeBABE conjugated to the DNA upstream of the TATA Box. f, Model of the Mot1:TBP:DNA complex. Electron density map of EcMot1BeF:EcTBP complexes with the crystal structure of EcMot1NTD:EcTBP including a superimposed elongated DNA from ScTBP:DNA complex (1YTB). Bases that represent 5-I dU substitutions used for crosslinking ScMot1 to DNA15 and bases that represent FeBABE probe 4Fe (Suppl. Fig. 7a) are colored in magenta and green, respectively. Positions of FeBABE conjugation that did not produce cleavage are colored in gray. The position of the Swi/Snf2 domain of Mot1 is indicated as an orange mesh.

