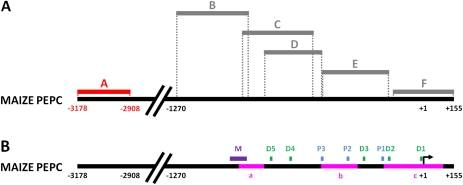
Fig. 4.
Cytosine methylation in the ∼1 kb upstream region of the TSS does not correlate with PEPC expression. The methylation status of PEPC promoter region +155 to –1270 in roots, dark-grown leaves, and M and PBS cells of maize leaves transferred to light for 72 h is shown in panel (A). Grey bars indicate amplicons where no methylation was detected. Red bars indicate differentially-methylated regions. Dashed lines show the position of amplified sequences on the maize PEPC promoter. Regions amplified from bisulphite treated DNA are as follows: (A) –3178/–2908; (B) –1270/–888; (C) –902/–551; (D) –817/–518; (E) –521/–176; (F) –158/+155. The sites of protein complex binding relative to the maize PEPC promoter sequence are indicated in panel (B). Abbreviations are as follows: M, MNF1; D, DOF; P, PEP-I. The positions of CpG islands in the PEPC promoter predicted by Methprimer™ software are depicted as pink bars in panel (B) (a, –946 to –817; b, –782/–595; c, –200/+105). The program settings were as follows: 100 bp segments, observed/expected CpG dinucleotides >0.6 and 50% GC content.

