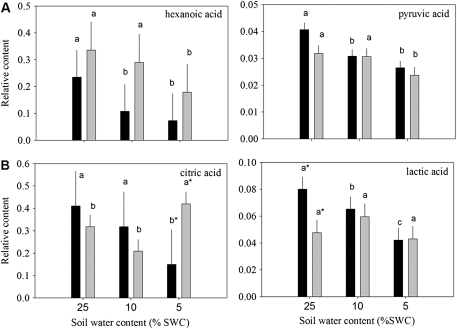
Fig. 5.
Relative content of organic acids based on comparison with ribitol as an internal standard and total area of peaks within a given treatment generally (A) reduced or (B) oppositely accumulated in leaves of null transformant (NT) and SAG12-ipt transgenic creeping bentgrass leaves in response to drought stress. Vertical bars indicate the SEM. Different letters indicate significant differences due to soil water content (% SWC) within a plant type and asterisks indicate significant differences at a given level of SWC between plant types (P ≤ 0.05). Note the y-axis scaling differences for ease of comparison among treatments of a given metabolite.

