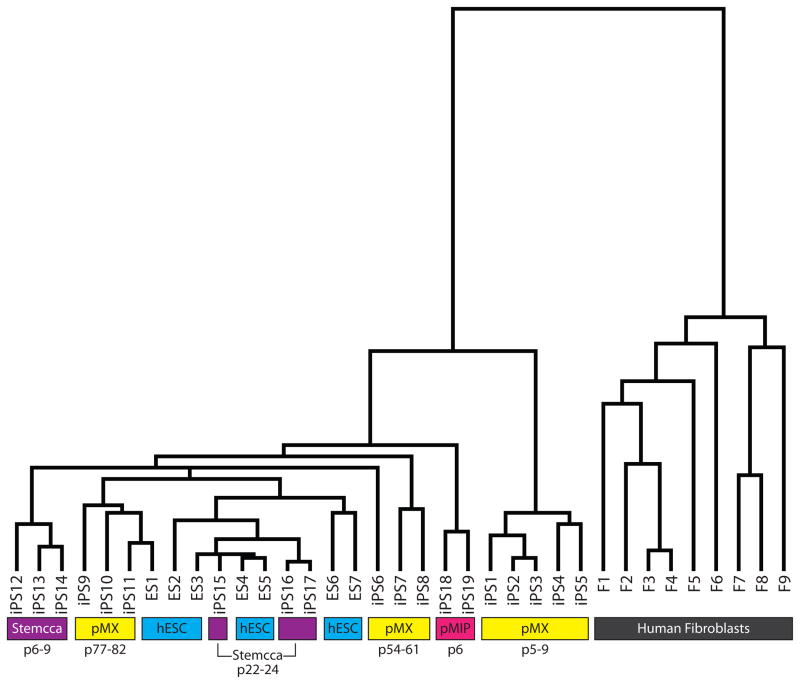
Figure 2. Variation in gene expression between hiPSCs and hESCs generated in our laboratories using different technical strategies.
Hierarchical clustering of expression data obtained for hESCs (blue highlight), various hiPSCs at different passage (p) (yellow for single pMX-retroviral hiPSCs, pink for polycistronic pMIP retroviral hiPSCs, and purple for polycistronic STEMCCA lentiviral hiPSCs), and fibroblasts (F, gray). The Supplemental Methods section provides further identification for each cell line.

