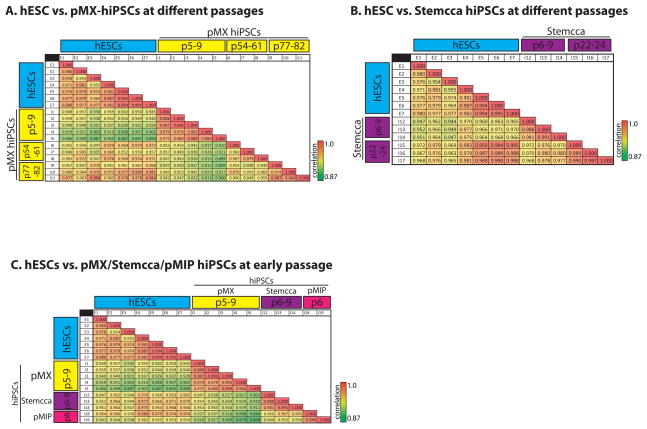
Figure 3. Extended passaging brings the gene expression signature of hiPSCs closer to that of hESCs.
(A) Correlation table comparing normalized and filtered microarray data for hESC lines to hiPSCs generated with 4 separate pMX retroviruses, which were profiled at different passages (p) as indicated in the yellow highlight. Values present the Pearson’s correlation coefficient between two cell lines.
(B) Correlation table comparing hESC lines to hiPSCs generated with the polycistronic STEMCCA lentivirus at different passages.
(C) Correlation table comparing hESCs to hiPSCs at early passage derived from the three unique reprogramming experiments: 4-factor pMX-hiPSCs (yellow), polycistronic STEMCCA lentivirus (purple), and polycistronic pMIP retrovirus (pink).

