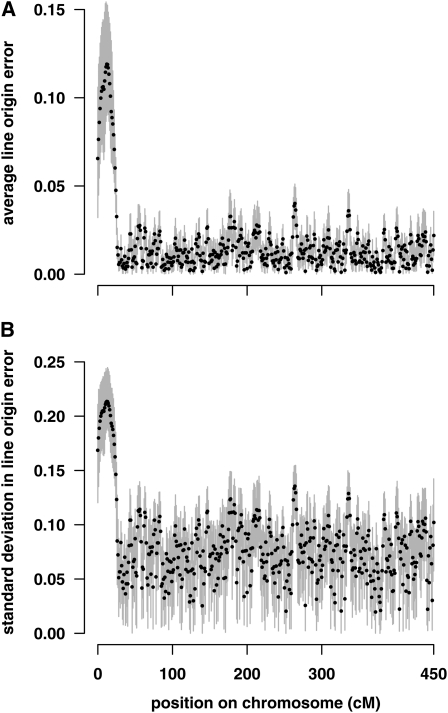
Figure 2 .
Line origin error for triM. (A) Average line origin error at each position over both haplotypes and all individuals. Dots show the average for 1000 simulation replicates, and gray bars indicate the minimum and maximum average line origin error obtained for a single replicate. (B) Standard deviation in line origin error at each position. Dots show the average standard deviation for 1000 simulation replicates, and gray bars indicate the minimum and maximum standard deviations obtained for a single replicate.

