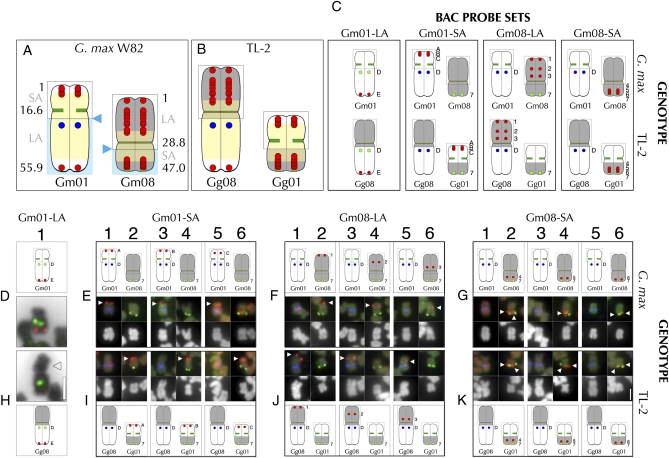
Figure 2 .
FISH-based characterization of translocation line TL-2. (A) Diagram of Gm01 and Gm08 in G. max W82. Numbers indicate positions (in bp or Mb) in the pseudomolecule of each chromosome. For Gm01, the short arm (“SA”) is comprised of the 5′ end (bp “1”) through the centromere region (at ∼16.6 Mb); the long arm (“LA”) extends from the centromere to the 3′ end (at 55.9 Mb in the pseudomolecule). For Gm08, the long arm (“LA”) is comprised of the 5′ end (bp “1”) through the centromere region (at ∼28.8 Mb); the short arm (“SA”) extends from the centromere to the 3′ end (at 47.0 Mb). The yellow shading depicts the approximate extent of high-repeat content sequence that defines pericentromeric chromatin. The paired red dots indicate positions of BAC probes used in mapping experiments (representative FISH images are shown; see Table S2 for complete series). The blue triangles indicate the approximate breakpoint positions for TL-2; the gray outlines represent chromosome structure unaffected by the translocation. The blue shading indicates the chromosome sections that the BACs were mapped relative to in (D–K). (B) Model of the TL-2 translocation chromosomes. Gg08 (Glycine gracilis chromosome 8) is comprised of sequences homologous to Gm08-LA, the Gm08 centromere, and the Gm01-LA; Gg01 is comprised of sequences homologous to Gm01-SA, the Gm01 centromere and the Gm01-SA. (C) Data summary of the probe sets used in FISH for G. max W82 (D–G) and TL-2 (H–K). (D1) G. max Gm01 hybridization with Gm01-LA markers: SB86 repeat probe (“D” in diagram, green hybridization signal in FISH panel) and the terminal Gm01-LA BAC probe, Gm01-BAC-E (“E” in diagram, red hybridization signal in FISH panel). (H1) Hybridization to the aberrantly large TL-2 chromosome with Gm01-LA markers: SB86 repeat probe (“D” in diagram, green hybridization signal in FISH panel) and the terminal Gm01-LA BAC probe, Gm01-BAC-E (“E” in diagram, red hybridization signal in FISH panel). The arrowhead indicates the aberrantly large chromosome arm associated with the Gm01-LA-homologous probes in the mutant. The DAPI signal in (D1) and (H1) is inverted to black to accentuate chromosome structure. In the G. max W82 BAC mapping control experiments (E–G), the upper panels are diagrams of the FISH data (middle panels), and corresponding DAPI-stained chromosomes (lower panels). In the TL-2 BAC mapping experiments (I–K), the lower panels are diagrams of the FISH data (uppermost panels), and corresponding DAPI-stained chromosomes (middle panels). In (E–G) and (I–K), three FISH probe hybridization signals are detected: the BAC probe tested (e.g., Gm01-BAC-A= “A” in diagrams, with red hybridization signal, indicated by arrowhead), a Gm01-LA marker (“D” in diagrams, indicating the SB86 repeat probe, with blue hybridization signal) and a Gm08-SA marker (“7” in diagrams, indicating Gm08-BAC-7, with green hybridization signal). (E and I) The Gm01-SA probes (Gm01-BAC-A, -B, and -C) hybridized to Gm01-SA in G. max W82 (E1, E3, and E5, respectively), but to the arm opposite the Gm08-SA-homologous arm in TL-2 (I2, I4, and I6, respectively). (F and J) The Gm08-LA probes (Gm08-BAC-1, -2, and -3) hybridized to Gm08-LA in G. max W82 (F2, F4, and F6, respectively), but to the arm opposite the Gm01-LA-homologous arm in TL-2 (J1, J3, and J5, respectively). (G and K) The Gm08-SA probes (Gm08-BAC-4, -5, and -6) hybridized to Gm08-SA in G. max W82 (G2, G4, and G6, respectively), and also to the Gm08-SA-homologous arm in TL-2 (K2, K4, and K6, respectively). The high hybridization background of the red probes used in the experiments in (E5), (I5), (G1), and (K1) obscures the blue SB86 hybridization signal, which more evident when the blue channel is examined individually. The 2-µm scale bar in (H1) is valid for FISH and chromosome panels (D1). The 2-µm scale bar in (K6) is valid for (E–G) and (I–K).

