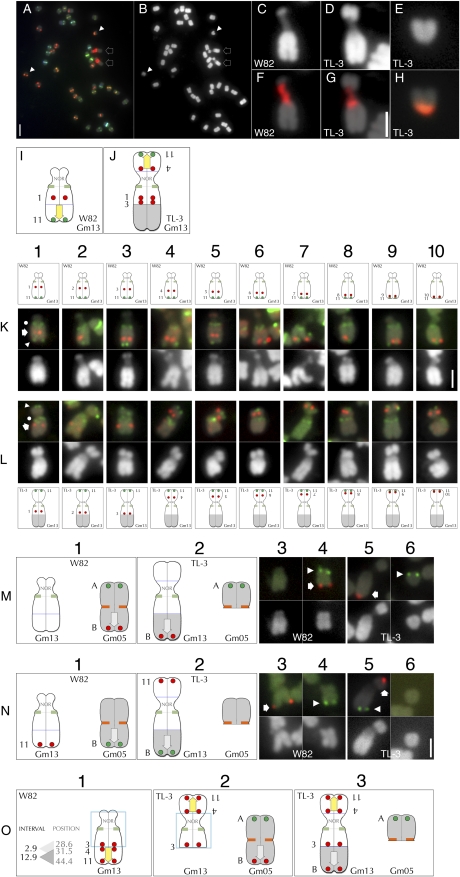
Figure 4 .
FISH-based characterization of translocation line TL-3. (A) FISH with Cent-Gm cocktail supplemented with an 18S-rDNA probe of a TL-3 chromosome spread. (B) The DAPI channel of the chromosomes in (A). The two outline-arrows in (A) and (B) indicate the aberrantly large chromosome pair that also hybridized to the rDNA probe; whereas the two arrowheads indicate the aberrantly small chromosome pair. (C–E) Enlarged images of DAPI-stained chromosomes: (C) a normal Gm13 in G. max W82, (D) the aberrantly large TL-3 chromosome, (E) the aberrantly small TL-3 chromosome. (F) and (G) show 18S-rDNA probe hybridization (red signal) of the chromosomes in (C) and (D), respectively; whereas the aberrantly small TL-3 chromosome in (H) is hybridized to the Cent-Gm probe cocktail. Panels (I) and (K) are diagrammatic summaries of the FISH experiments performed in (K-L) using a series of Gm13-LA BAC probes (Gm13-BAC-1 through -11; see Table S2). (K1–K10) The upper, middle, and lower panels are the chromosome diagram, FISH signal, and DAPI signal, respectively, for G. max W82 Gm13. The chromosome in each FISH panel has signal derived from three probes: a single tested Gm13-LA BAC (red hybridization signal, indicated in the K1 FISH panel by the arrow), plus Gm13-BAC-11 (green, chromosome-terminal hybridization signal, indicated in the K1 FISH panel by the arrowhead) and the Cent-Gm cocktail (the green, centromeric hybridization signal, indicated in the K1 FISH panel by the dot). In (K1–K10), the Gm13 BAC probes hybridized to positions spanning from Gm13-LA-proximal (K1) to Gm13-LA-terminal (K10). (L1–L10) The upper, middle, and lower panels are the FISH signal, DAPI signal, and the chromosome diagram, respectively, for TL-3 Gm13. The chromosome in each FISH panel has signal derived from three probes, as described for (K1–K10). In (L1–L10), Gm13-BAC-11 hybridized to a terminal position on the shorter arm of the aberrant Gm13 form in TL-3. (L1–L3) Only the three most centromere-proximal Gm13-BAC probes (Gm-BAC-1 through -3) hybridized near the centromere of the longer arm of the mutant Gm13. (L4–L10) Each of the remaining Gm13 BAC probes (Gm13-BAC-4 through -10) hybridized sequentially more distally, on the shorter arm of TL-3 Gm13. (M and N) FISH utilizing pseudomolecule-derived BAC probes to map the TL-3 translocation. The G. max W82 chromosome diagrams in each column 1 panel correspond to the G. max W82 FISH images in columns 3 and 4; the TL-3 chromosome diagrams in each column 2 panel correspond to the TL-3 FISH images in columns 5 and 6. In columns 3-6, FISH hybridization panels are shown above their corresponding DAPI-stained chromosomes. (Row M) In G. max W82 (M1), Gm05-BAC-A (labeled “A” in column 1) hybridized to one end of Gm05 (red hybridization signal in M4, indicated by arrow); Gm05-BAC-B (labeled “B” in column 1) hybridized to the opposite end of Gm05 (green hybridization signal in M4, indicated by arrowhead). In TL-3, Gm05-BAC-A (labeled “A” in column 2) hybridized to a centromere-distal position on the arm of the aberrantly small chromosome (green hybridization signal in H6, indicated by arrowhead); Gm05-BAC-B (labeled “B” in column 2) hybridized to the distal end of the longer arm of the aberrant Gm13 (red hybridization signal in (H5), indicated by arrow). (Row N) In G. max W82, Gm13-BAC-11 (labeled “11” in column 1) hybridized to the distal end of the Gm13-LA (red hybridization signal in (N3), indicated by arrow); Gm05-BAC-B (labeled “B” in column 1) hybridized to the 3′ end of Gm05 (green hybridization signal in (N4), indicated by arrowhead). In TL-3 (N2), Gm13-BAC-11 (labeled “11” in column 2) hybridized to a distal position on the shorter arm of the aberrant Gm13 (red hybridization signal in (N5), indicated by arrow); Gm04-BAC-B (labeled “B” in column 2) hybridized near the terminus of the longer arm of the same chromosome (green hybridization signal in (N5), indicated by arrowhead). (Row O) Model of the events that generated the chromosome forms in TL-3. (O1) Diagram of the normal Gm13. “Position” indicates the position, in Mb of the central bp of a given BAC in the Gm13 pseudomolecule (e.g., Gm13-BAC-3 is at 28.6 Mb in the Gm13 pseudomolecule; see Table S2 for details); whereas “Interval” numbers represent the window in Mb between BAC probe “Position” numbers. Thus, in the first event, a chromosome break occurred in the 2.9 Mb interval between sequences corresponding to Gm13-BAC-3 and Gm13-BAC-4, thereby releasing a ∼12.9 Mb segment of the Gm13-LA. This segment then became associated with the NOR-containing satellite arm (O2, left chromosome). The yellow arrow in (O1–O3) indicates the polarity of the translocated Gm13-LA fragment; the blue box indicates the possibility that Gm13 may have experienced a pericentromeric inversion involving two breaks. Next, a fragment comprising most of 3′ end of Gm05 (O2, right chromosome) was translocated to the broken end of the Gm13-LA to generate the chromosome forms in O3. The gray arrow in (O2 and O3) indicates the polarity of the translocated Gm05 fragment. The 2-µm scale bar in (A) is also valid for (B). The 2-µm scale bar in (G) is valid for (C–H). The 2-µm scale bar in (K10) is valid for (K–L). The 2-µm scale bar in (N6) is valid for (M) and (N).

