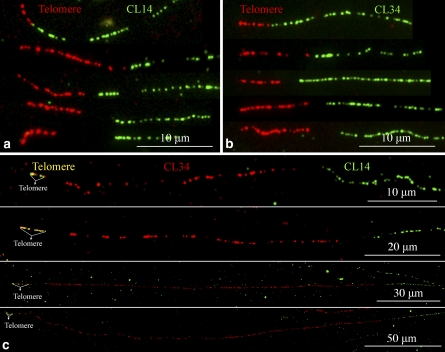
Figure 6 .
Fiber-FISH analyzing the association of CL14 and CL34 repeats with telomeric DNA. (a) Five representative fiber-FISH signals derived from probes pAtT4 (red) and CL14 (green). (b) Five representative fiber-FISH signals derived from probes pAtT4 (red) and CL34 (green). Only the most proximal part of each CL14/CL34 signal was included in each image. Note the different sizes of the telomeric DNA and gap in the junctions, indicating these signals may be derived from different chromosomal ends. (c) Fiber-FISH analysis of telomere (yellow), CL34 (red), and CL14 (green). The CL34 signals within the four images show significantly different sizes. Only the most proximal part of each CL14 signal was included in the image.

