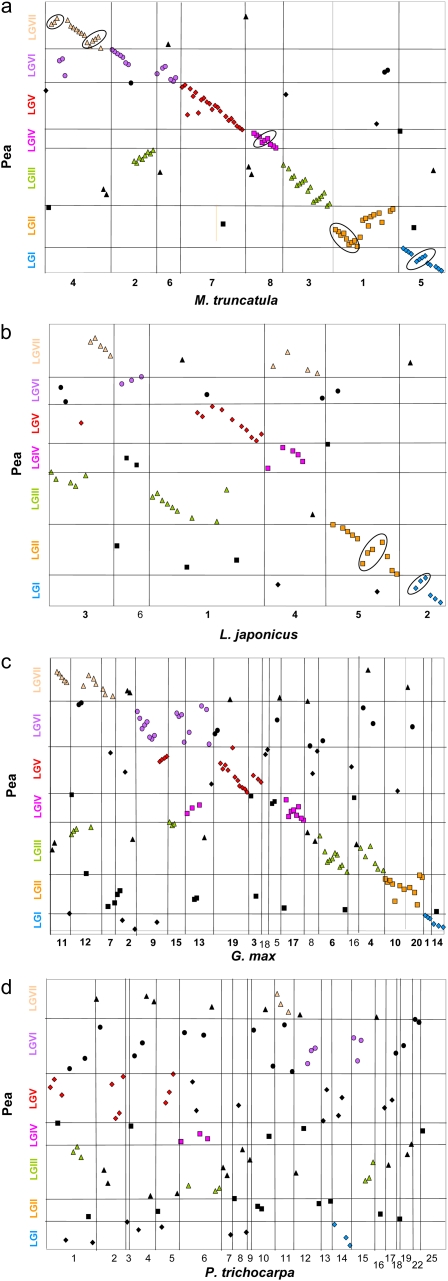
Figure 2 .
Dot-plots of syntenic relationships between the P. sativum linkage groups (LG) and M. truncatula (a), L. japonicus (b), G. max (c), and P. trichocarpa (d) pseudo-chromosomes. The best reciprocal homologs are placed on the dot-plot according to their position on the pea LG (Y-axis) and their position on the pseudo-chromosomes (x-axis). Synteny conservation is evidenced when homologs symbols are placed on diagonal lines. Rearrangements are circled. Syntenic blocks are highlighted according to pea LG (blue diamonds: gene mapped on PsI; yellow squares: PsII; green triangles: PsIII; pink squares: PsIV; red diamonds: PsV; purple circles: PsVI; pink triangles: LGVII); symbols are color-coded when at least three best reciprocal homologs are found between a pea LG and M. truncatula, L .japonicus, G. max, or P. trichocarpa pseudo-chromosomes.

