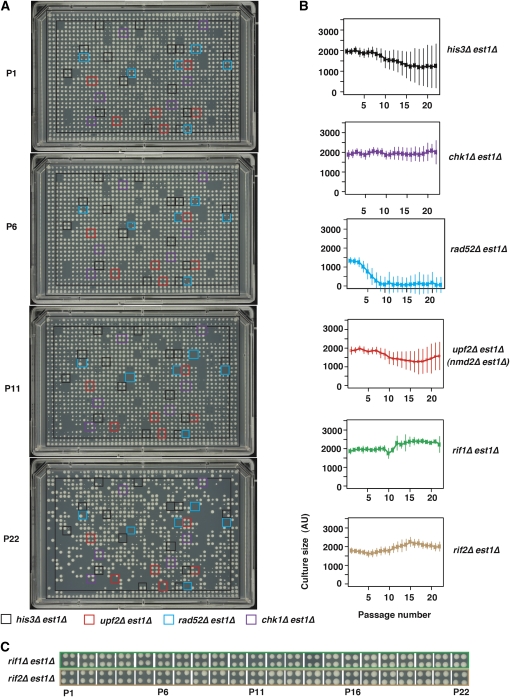
Figure 3 .
High-throughput, solid-culture-based senescence assay. 1536 parallel colonies were transferred from agar plates, photographed, and analyzed. (A) Example images showing culture size at passages 1, 6, 11, and 22. Representative sets of four independent cultures of four genotypes are indicated by colored boxes. Plate number 15 is presented, which has 24 independently generated double mutant cultures per genotype, whereas plates 1 to 14 only have 4 independent cultures per strain. (B) Mean density profiles (MDP) for six genotypes for 22 passages. Mean culture size and standard deviations are shown. (C) Examples of rif1∆ and rif2∆ strain growth during passage. All images can be browsed on our supplementary website (http://research.ncl.ac.uk/colonyzer/ChangSenescence/#images).

