Figure 4 .
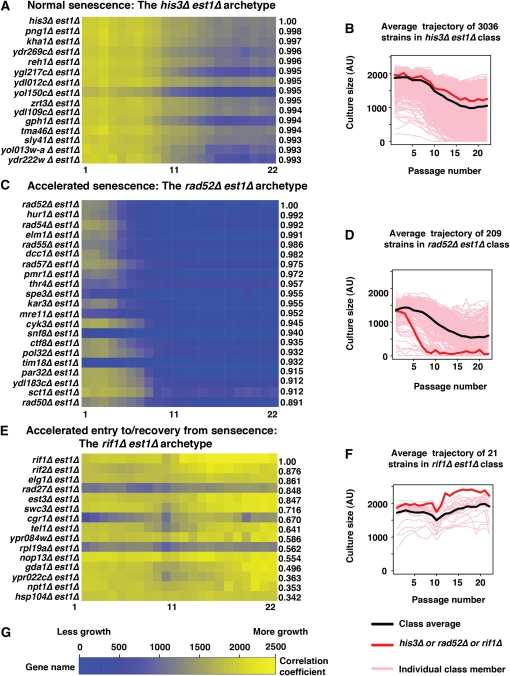
Three senescence profile archetypes. Mean density profiles (MDP) were estimated for each of 4300 gene deletions combined with est1∆. Pearson’s correlation coefficient (r) was calculated for each mutation compared with his3∆, rad52∆, and rif1∆ mutations, representing three distinct senescence curve archetypes. (A) A heat map showing the MDP of the mutations having the 14 highest correlations with that of his3∆ est1∆. (B) All 3035 MDPs (pink) correlating strongly (r > 0.85) are shown along with the MDP of the archetype his3∆ est1∆ (red), and the mean curve of the 3036 strongly correlating MDPs (black). (C) A heat map showing the MDP of the mutations having the 20 highest correlations with that of rad52∆ est1∆. To construct this group, we only included strains whose culture size at passage 2 was less than Cs = 1680, where Cs = Cave – 0.5*CSD, Cave is the average of all double mutant culture sizes at passage 2, CSD is the culture size standard deviation at that passage. (D) All 208 MDPs (pink) correlating strongly (r > 0.5, culture size < Cs) with the MDP of rad52∆ est1∆ (red), together with the average of the 209 strongly correlating MDPs (black). (E) A heat map showing the MDP of the mutations having the 14 highest correlations with that of rif1∆ est1∆. (F) Twenty gene disruptions whose MDPs (pink) correlate best with the MDP of rif1∆ est1∆ (red), together with the average of the 21 most strongly correlating MDPs (black). (G) Scale for heat maps.

