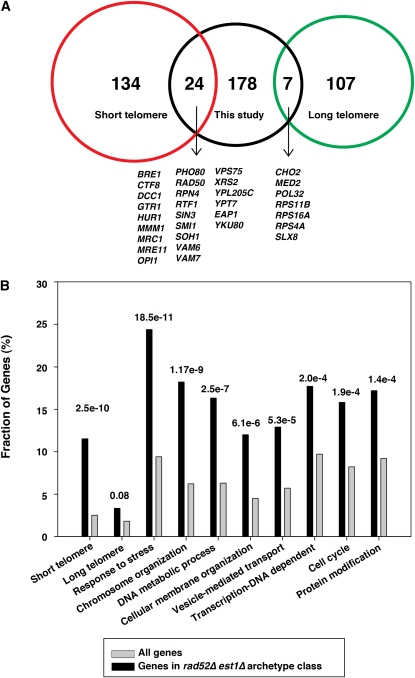
Figure 5 .
Properties of gene deletions that cause similar effects to rad52∆ in an est1∆ background. (A) Venn diagram showing gene deletions reported to result in significantly shorter (red) or longer (green) telomeres (Askree et al. 2004; Gatbonton et al. 2006; Shachar et al. 2008) and those we classified as similar to the rad52∆ est1∆ archetype (black). (B) Gene ontology (process) analysis demonstrating the P values for significance of over representation of terms (both GO terms and classifications from other screens) over represented in the class similar to the rad52∆ est1∆ archetype.

