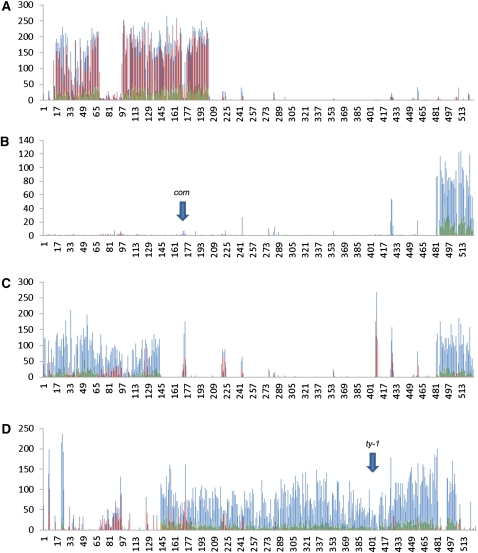
Figure 6 .
Distribution of polymorphisms on supercontig 3. (A) Strain FGSC 3114 containing the introgressed Sk-2 region. (B) Strain FGSC 106 with a vertical arrow showing the location of com. (C) Strain FGSC 305. (D) Strain FGSC 1363. Total SNPs are plotted in blue. Unique SNPs are plotted in red. Indels are plotted in green. Polymorphisms were sorted by supercontig and position and the total number in a 10 Kb moving window is plotted on the Y axis. The X axis corresponds to the position along the supercontig (X 10 Kb).

